Table 1.
Cytotoxicity of the target compounds 10–29 indicated with their IC50 values in three human cancer cell lines
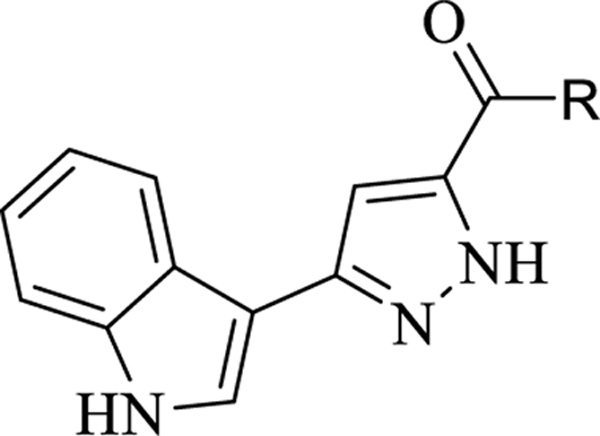
| ||||
|---|---|---|---|---|
| IC50 (μM) ± S.D. | ||||
| Compound | R | Huh7 | MCF-7 | HCT116 |
| 10 |
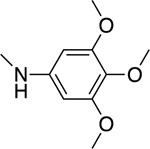
|
1.0±0.2 | 2.1±0.1 | 2.5±0.3 |
| 11 |
|
0.6±0.4 | 1.0±0.1 | 1.2±0.5 |
| 12 |

|
6.3±1.6 | 2.0±0.2 | 9.0±1.9 |
| 13 |
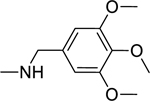
|
17.2±2.1 | 17.9±1.0 | 31.0±2.4 |
| 14 |

|
16.8±3.8 | 22.2±1.8 | NI |
| 15 |

|
8.6±2.1 | 5.5±0.5 | 11.9±1.0 |
| 16 |
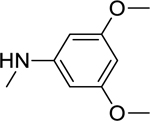
|
4.5±0.1 | 2.6±0.5 | 6.2±1.0 |
| 17 |

|
2.8±1.2 | 1.7±0.4 | 10.1±0.7 |
| 18 |
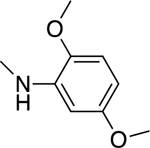
|
0.6±0.1 | 3.6±0.4 | 1.4±0.5 |
| 19 |

|
19.1±1.8 | 21.7±2.0 | 23.0±3.5 |
| 20 |

|
NI | NI | NI |
| 21 |
|
NI | 26.7±0.5 | 23.1±5.1 |
| 22 |

|
NI | 29.8±3.1 | NI |
| 23 |

|
NI | 39.3±1.0 | NI |
| 24 |

|
30.4±1.4 | 31.2±2.6 | 33.2±1.0 |
| 25 |

|
29.1±1.0 | 36.5±4.0 | 26.8±2.1 |
| 26 |

|
35.4±1.8 | NI | 34.0±1.1 |
| 27 |

|
6.8±0.7 | 8.6±0.2 | 8.9±0.7 |
| 28 |
|
16.2±3.2 | 16.1±1.7 | 27.6±2.4 |
| 29 |

|
1.7±1.8 | 3.0±0.8 | 4.1 ±2.0 |
| Sorafenib | 6.5±0.7 | 13.8±1.2 | 12.0±0.6 | |
NI: no inhibition (maximum concentration examined, 50 μM)
