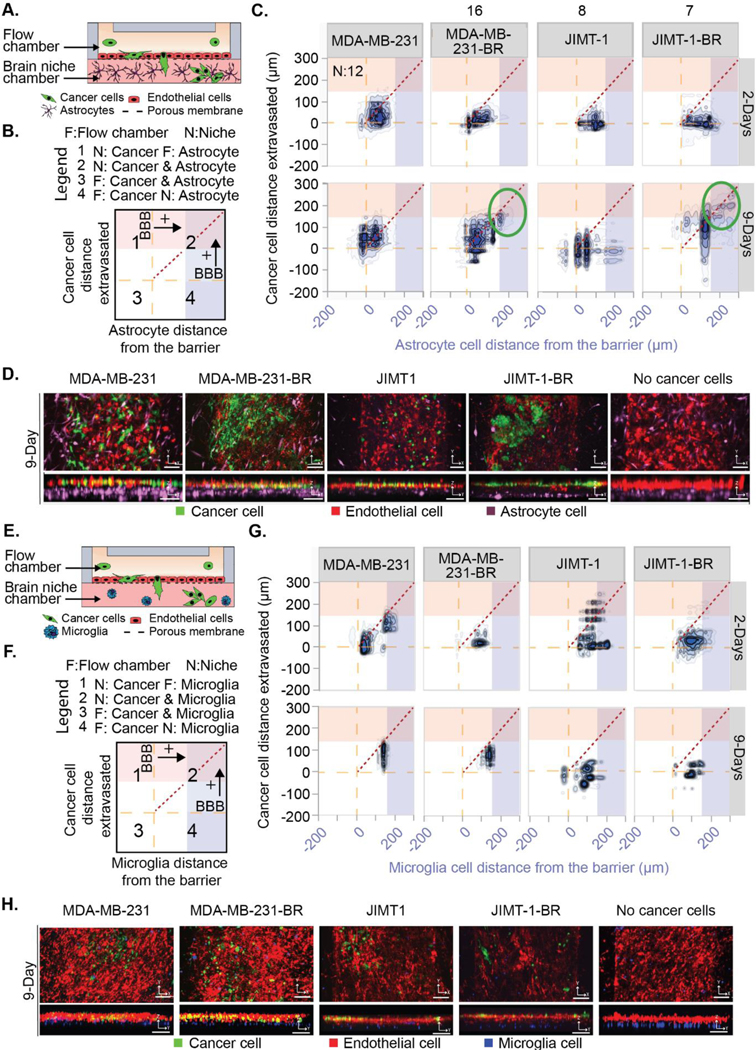
Figure. 1. Brain-metastatic cancer cells extravasate towards astrocyte cells.

(A and E) Schematic of a BBNiche with (A) astrocytes or (E) microglia in the brain niche chamber. Cancer cells in the top flow chamber interact with the BBNiche for 2- and 9-Days. (B and F) Legend for (C) and (G) respectively. Each quadrant shows interactions between cancer cells and brain niche cells. The yellow dashed line represents the endothelial barrier. Red and blue overlay denote a distance from barrier > 150 μm. (C and G) 2-D density plot of cancer cell and (C) astrocyte or (G) microglia interaction for MDA-MB-231, MDA-MB-231-BR, JIMT-1, JIMT-1-BR for 2- and 9-Days. (D and H) Representative fluorescent confocal images of cancer cells in BBN chips with (D) astrocytes or (H) microglia after 9-Days. Images are in the XY and YZ planes, scale bar = 125 μm. A list of replicates per condition are given in Table S1.
