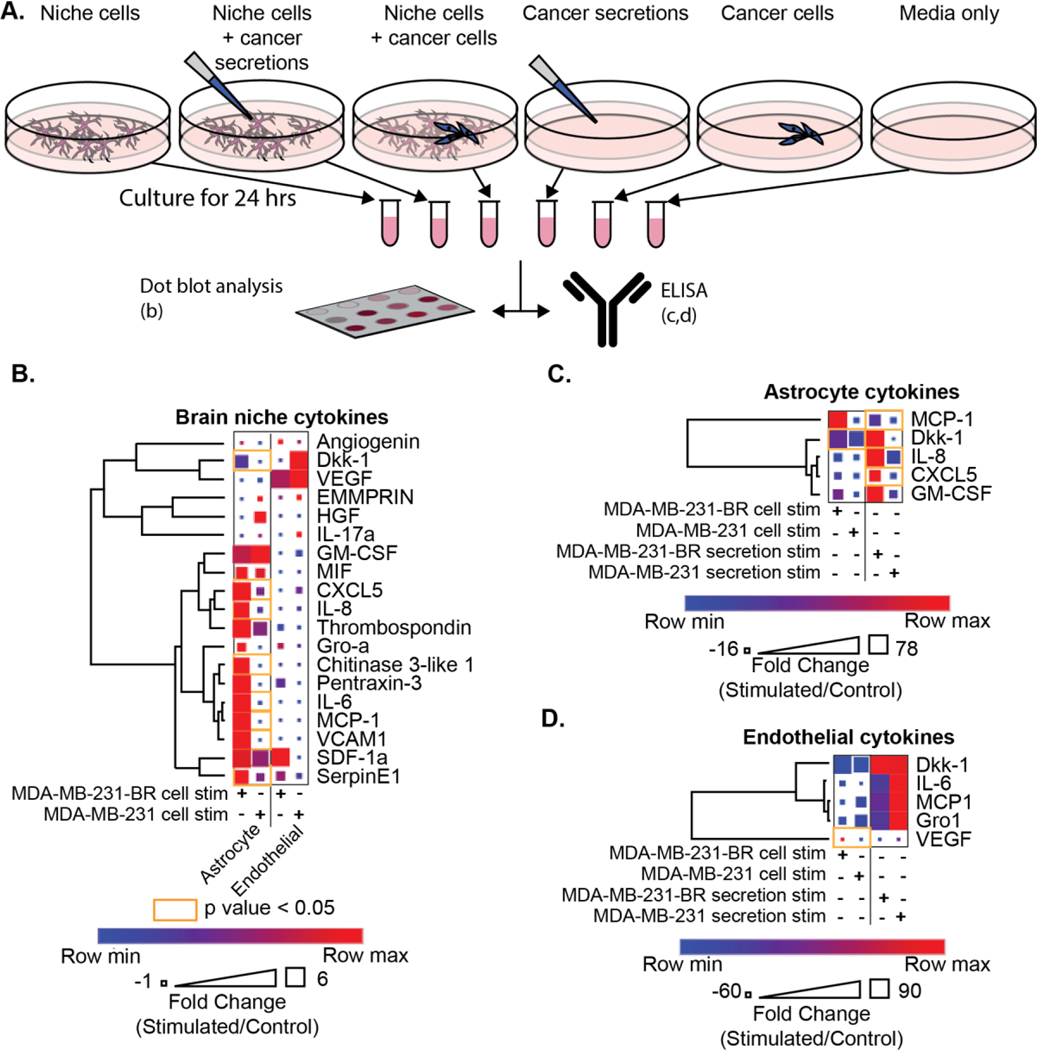
Figure 4. Brain niche cytokine profiles are altered after interaction with cancer cells.
(A) Schematic showing collection of conditions used for cytokine profiling and distribution to a dot blot assay and ELISA. (B) Human XL cytokine dot blot array results for astrocyte and endothelial cell secretions; when stimulated with either MDA-MB-231-BR or parental MDA-MB-231 and normalized to a non-stimulated control. Heatmap colors indicate row comparisons of each cytokine level; blue (low) to red (high). Square size indicates overall cytokine protein levels. (C-D) ELISAs of (C) astrocyte or (D) endothelial secretions after stimulation with either cancer cells or paired secretions were normalized to unstimulated secretion controls. For all assays, orange outlines indicate statistically significant comparisons and t-tests with Holm-Šídák multiple comparisons correction were utilized. The assays were performed in triplicate.

