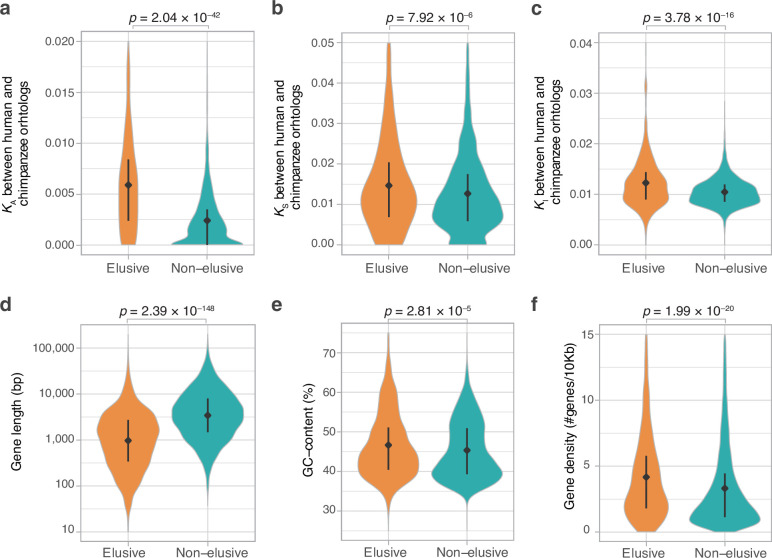
Figure 2. Genomic and evolutionary characteristics of elusive genes.
Distributions of non-synonymous, synonymous, and intronic nucleotide substitution rates, namely KA (a), KS (b), and KI (c) values, respectively, between the human–chimpanzee orthologs of the elusive and non-elusive genes. Distribution of gene length (d) and GC content (e) of the human elusive and non-elusive genes. (f) Distribution of gene density in the genomic regions where the human elusive and non-elusive genes are located. The plots consist of 249 elusive and 5145 non-elusive genes that retained chimpanzee orthologs (a, b), 473 and 4626 of those which harbored introns aligned with the chimpanzee genome (c; see ‘Materials and methods’), and all of the 813 elusive and 8050 non-elusive genes (d–f). Diamonds and bars within violin plots indicate the median and range from the 25th to 75th percentile, respectively.


