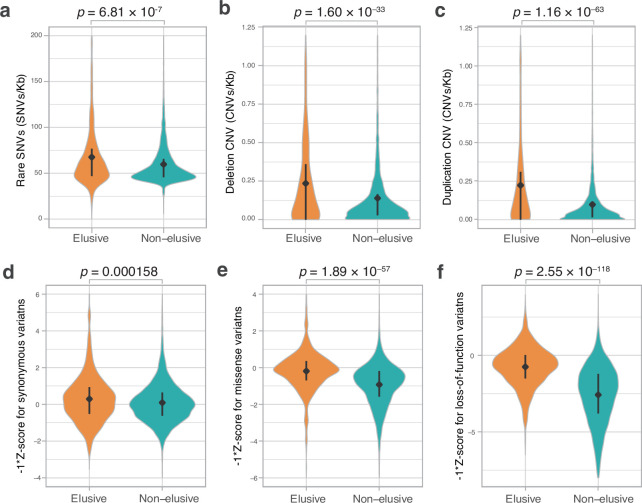
Figure 4. Genetic variations of the elusive and non-elusive genes within human populations.
Comparison of the density of rare single-nucleotide variants (SNVs) (a), deletion copy number variants (CNVs) (b), duplication CNVs (c), and Z-scores of synonymous (d), missense (e), and loss-of-function variants (f). We used opposite numbers of the Z-scores in d–f so that the elusive genes have higher values than non-elusive genes as in Figure 2a, b, c, e, f and Figure 3a–c. (a–c) 813 elusive genes and 8050 non-elusive genes were used. (d–f) 544 elusive genes and 7303 non-elusive genes for which genetic variants were available in GnomAD were used. Diamonds and bars within violin plots indicate the median and range from 25th to 75th percentile, respectively.

