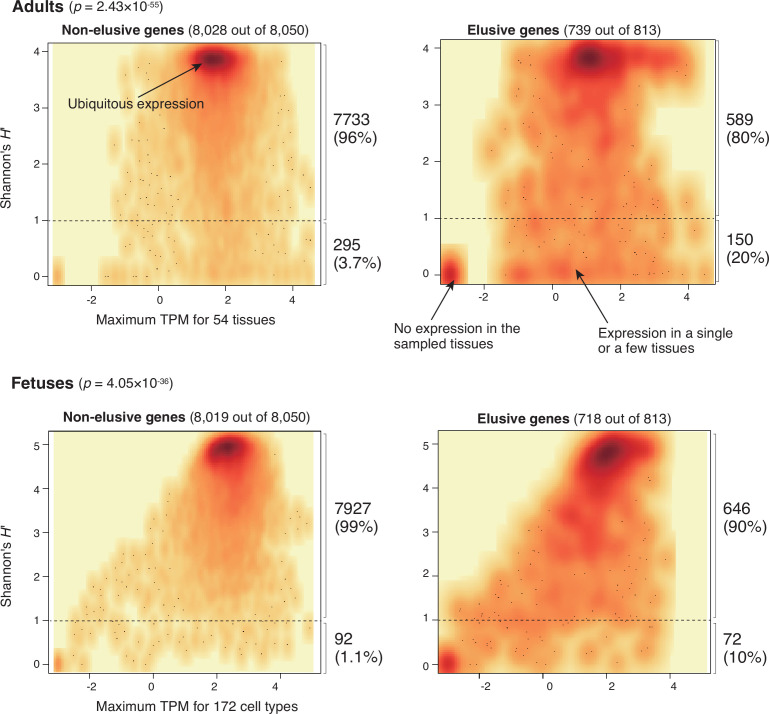
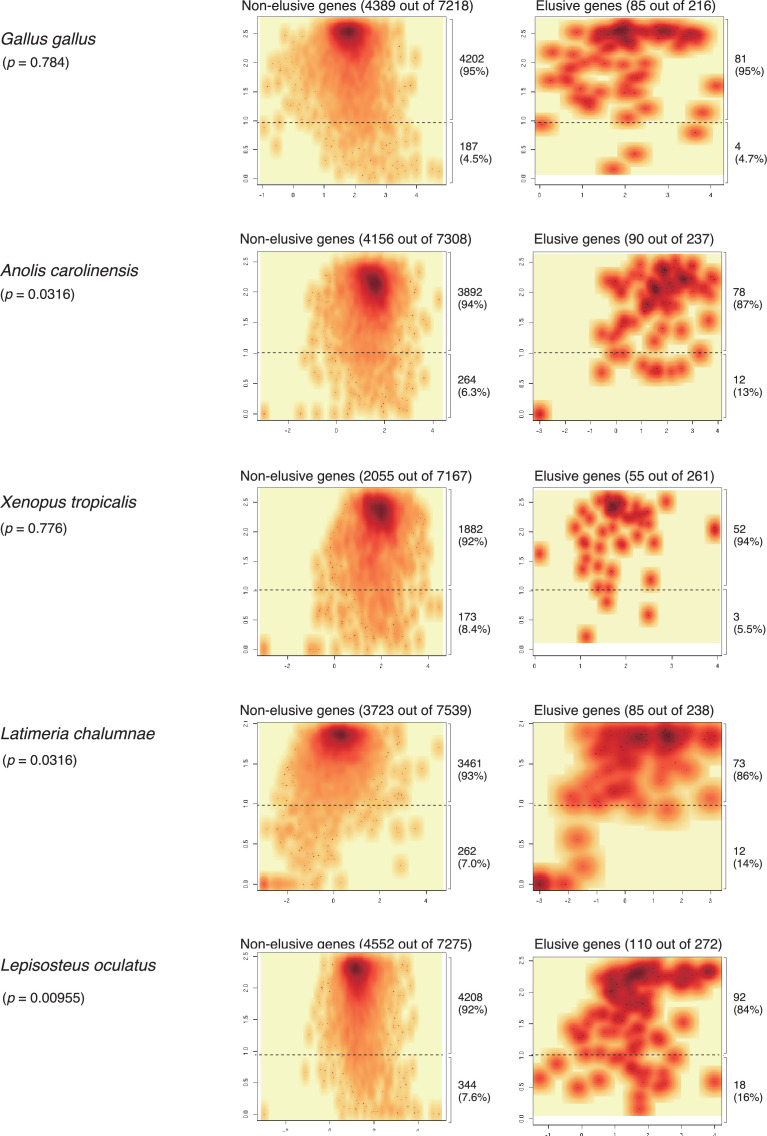
Figure 5. Expression profiles of elusive and non-elusive genes.
The figure shows density scatter plots of the expression quantity and divergence of elusive and non-elusive genes. The numbers of the elusive/non-elusive genes and those for which the expression quantities were available are indicated in each panel. p-values were computed via 2 × 2 contingency tables presenting numbers of elusive and non-elusive genes with H′ < 1 and H′ ≥ 1. The median transcription per million (TPM) value of each of the adult tissue across individuals was retrieved from the GTEx database (The GTEx Consortium et al., 2020), and normalized TPM values of the fetal cell types were retrieved from the Descartes database (Cao et al., 2020). For the individual genes, maximum TPM and Shannon’s H′ values were computed using these processed TPM values.


