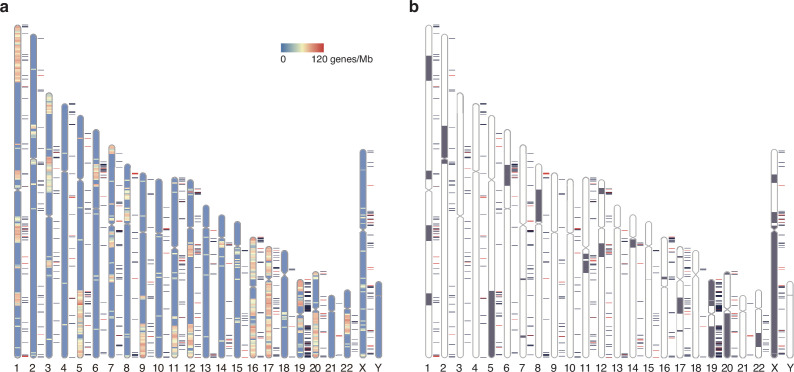
Figure 7. Chromosomal distribution of human elusive genes.
Red and dark blue horizontal bars beside the chromosome ideogram represent the location of elusive genes with restricted expression (Shannon’s H′ < 1) and the other elusive genes, respectively. (a) The chromosome diagrams are colored according to the density of the genes that harbor chicken orthologs in microchromosomes (number of genes/Mb). 93 and 68 elusive genes were orthologous to the chicken genes in macro- and microchromosomes, respectively, and 4211 and 2078 non-elusive genes were orthologous to the chicken genes in macro- and microchromosomes, respectively. This indicates that the chicken orthologs of the elusive genes are abundant in microchromosomes compared with those of the non-elusive genes (p=0.0175). (b) Gray regions in the diagram indicate orthologous regions of microchromosomes in the ancestors of gnathostomes (Nakatani et al., 2021). 395 and 296 elusive genes were located in the genomic regions corresponding to ancient macro- and microchromosomes, respectively, and 5950 and 1929 non-elusive genes were located in the genomic regions corresponding to these ancient chromosomes. The result recapitulates the biased localization of the elusive genes on microchromosomes (p=9.50 × 10⁻²⁴). The chromosome diagrams were drawn using RIdeogram (Hao et al., 2020).


