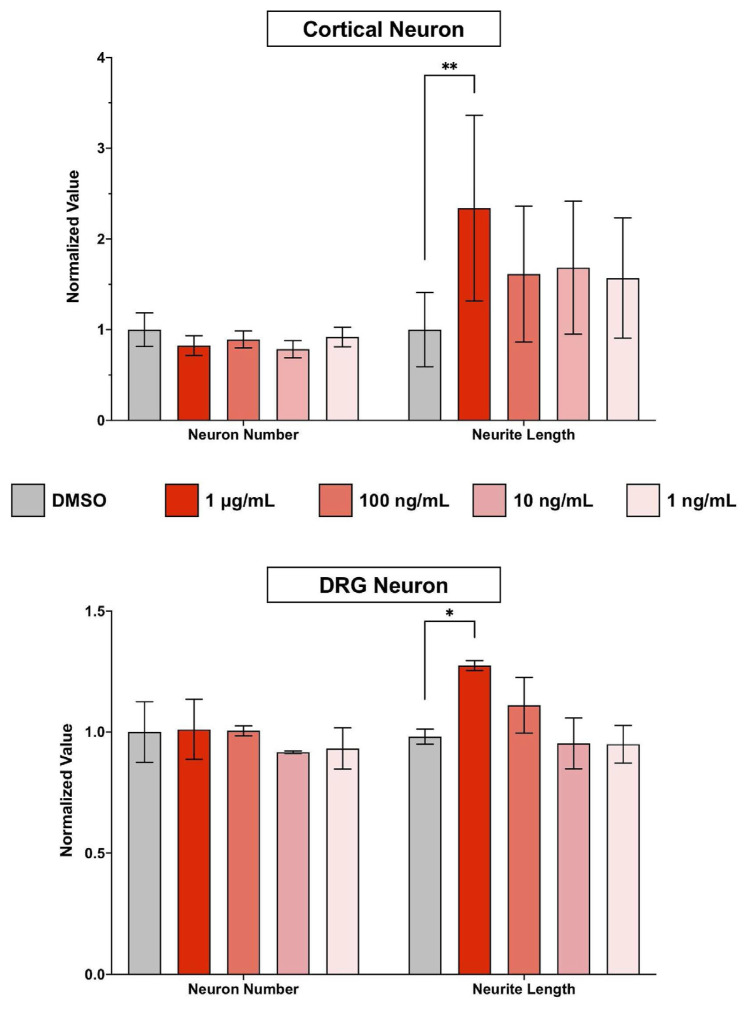
Fig. 1.
The cytotoxic and neurite outgrowth effect of erinacine S on primary CNS and PNS neurons. 2DIV (2 days in vitro) primary cortical neurons (top) and primary DRG neurons (bottom) were treated with indicated concentrations of erinacine S for 48 h. Quantification of neuron number (left) and total neurite length per neuron (right) from 3 independent experiments. The bar graphs are expressed as mean ± s.e.m. *p < 0.05, **p < 0.005, one-way ANOVA followed by Dunnett post-hoc analysis against the DMSO solvent control group.

