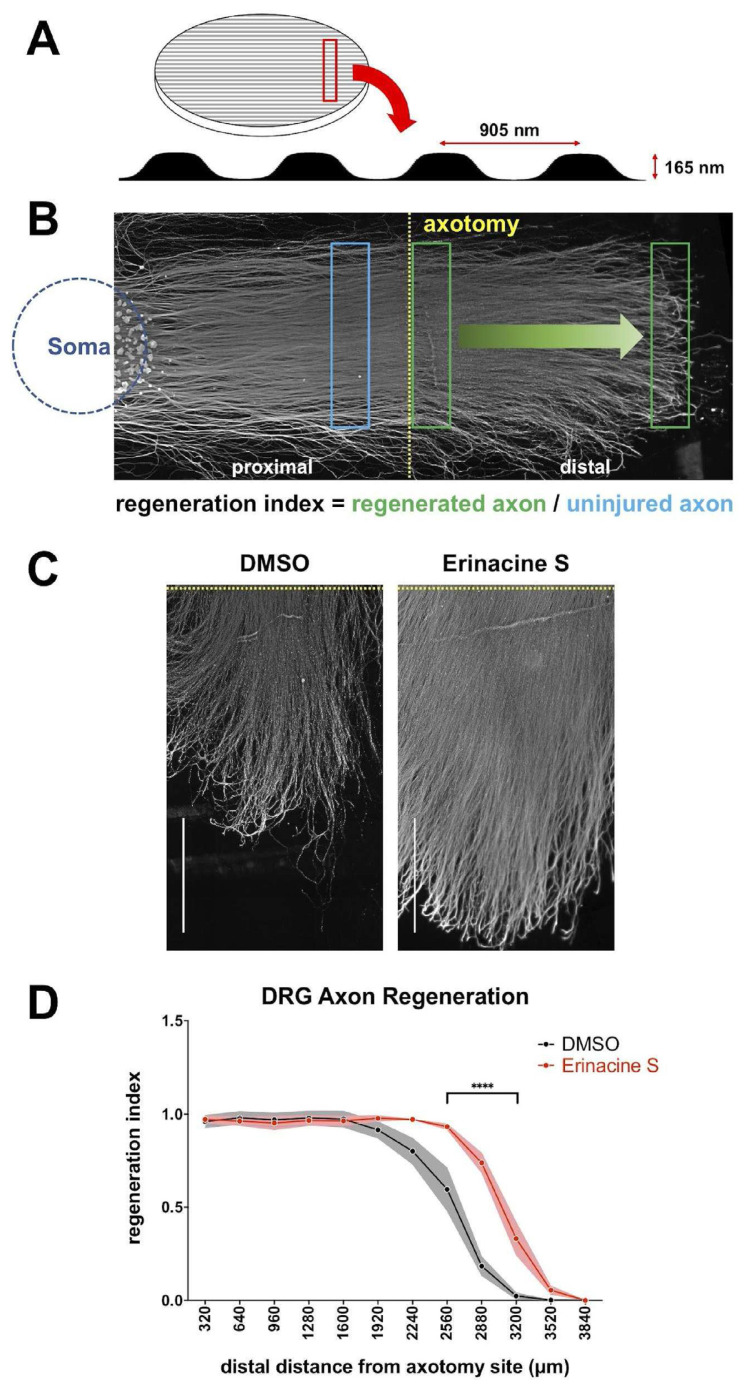
Fig. 3.
Erinacine S promotes DRG axon regeneration after axotomy. (A) The schematic diagram of the micropatterned coverslip (left) and the surface profile of the micropattern (bottom). The pitch and depth of the surface micropattern are indicated. (B) The representative image of a 9DIV rat DRG drop culture on the micropatterned coverslip that has undergone axotomy. The blue circle indicates where DRG neuronal cell bodies are located and the yellow dotted line demarcates the axotomy site. The blue rectangle indicates the region from which signal of uninjured axons was obtained, and the green rectangles indicate the regions from which the signal of regenerated axons was obtained. (C) Representative images of regenerated DRG axons in the presence of 1 μg/mL erinacine S or DMSO solvent control. DRG axons were immunofluorescence stained with the antibody against neuron-specific β–III–tubulin. Dotted yellow lines demarcate the axotomy sites. Both scale bars represent 1 mm. (D) Quantification of the post-axotomy DRG axon regeneration in the presence of 1 μg/mL erinacine S or DMSO solvent control. The Y–axis represents the regeneration index and the X-axis represents the distance along the regenerating axons from the axotomy site. Dots and shaded areas represent mean ± s.e.m. from 3 independent experiments. ****p < 0.0001, two-way ANOVA followed by Sidak post-hoc analysis against the DMSO control group.

