Fig. 5.
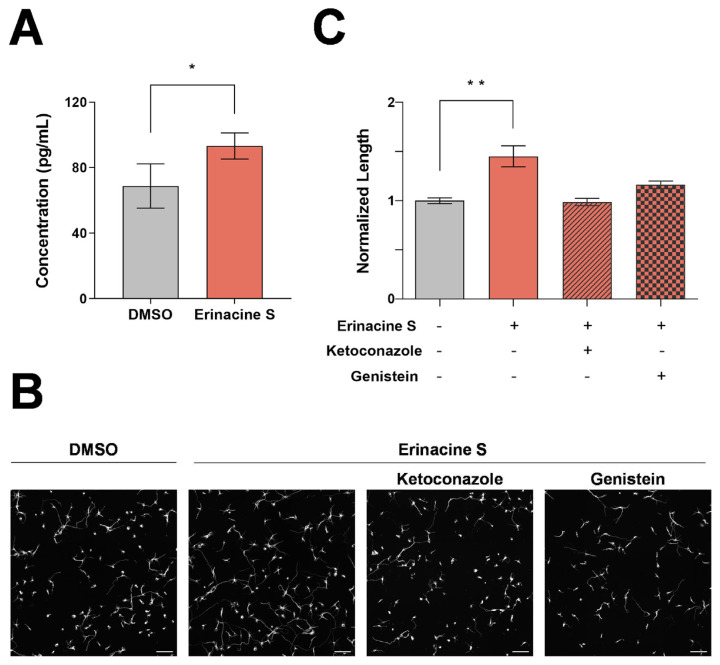
Functional validation of erinacine S causing the accumulation of neurosteroids in cortical neurons. (A) Quantification of the pregnenolone concentration in lysates of 2DIV dissociated mouse cortical neurons from 3 independent experiments. The bar graph is expressed as mean ± s.e.m. *p < 0.05, one-tailed paired Student's t-test. (B) Representative images of 2DIV dissociated mouse cortical neurons treated with DMSO (left most), 1 μg/mL erinacine S (middle left), 1 μg/mL erinacine S and 0.5 μM ketoconazole (middle right), 1 μg/mL erinacine S and 25 μM genistein (right most). Neurons were immunofluorescence stained with the antibody against neuron-specific β-III tubulin. All scale bars represent 100 μm. (C) Quantification of total neurite length per neuron in 2DIV cortical neurons treated with the indicated compounds from 2 independent experiments. The bar graph is expressed as mean ± s.e.m. **p < 0.01, one-way ANOVA followed by Dunnett post-hoc analysis against the DMSO solvent control group (gray bar).

