FIG. 2.
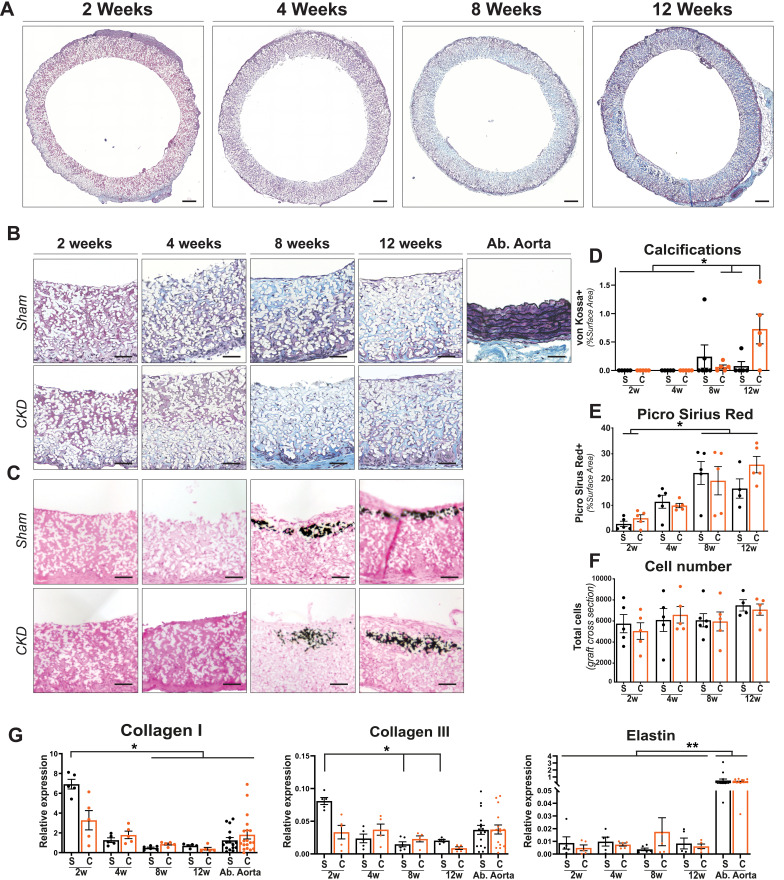
Histological evaluation on representative transverse sections. Explanted center part of the grafts at 2, 4, 8, and 12 weeks, stained with Masson's Trichrome Verhoeff (a). ECM formation and tissue buildup in sham and CKD animals over time, with an abdominal aorta as control. Visible are cytoplasma (pink), collagen (blue), elastin (black), and nuclei (dark blue). Electrospun fibers are visible in white. (b). Grafts stained with von Kossa and nuclear fast red to visualize calcification (black) in grafts explanted (c) and quantification thereof (d). Picro Sirius Red+ surface area showing an increase in ECM buildup over time (e). Total cell numbers in Sham(S) and CKD(C) graft (whole transverse sections) (f). Relative gene expression (2Δ−CT) of Collagen I, Collagen III, and Elastin (G) compared between Sham(S) and CKD(C) groups over time, with abdominal (Ab.) aorta from sham and CKD animals as controls. Scale bars represent 200(a) and 50 μm (b) and (c). Mean±SEM. **p < 0.01, *p < 0.05.

