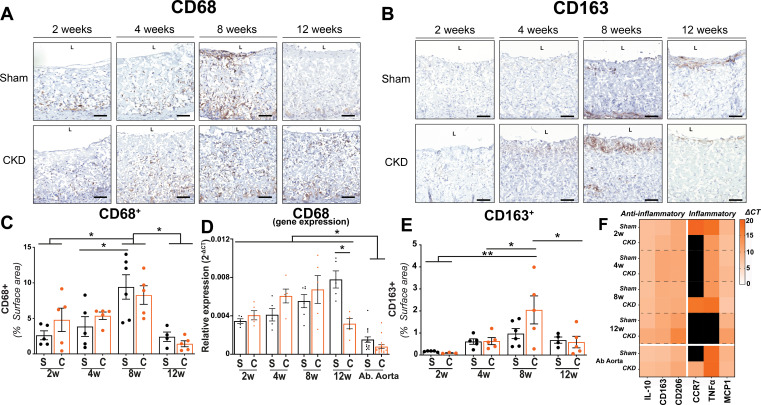
FIG. 3.
Histological evaluation of infiltration of immune cells. Transverse sections of the center part of the grafts, explanted at 2, 4, 8, and 12 weeks, stained for CD68+ (NovaRED) (A) and CD163+(NovaRED) (b), electrospun fibers are visible in white (a) and (b). Quantification of M1 macrophage marker CD68+ surface area percentage in Sham(s) and CKD(c) groups over time (c) and CD68 relative expression (2−ΔCT) with abdominal aortas (Ab Aorta) from Sham(s) and CKD(c) as controls (d). Quantification of M2 macrophage marker CD163+ surface percentage in Sham(s) and CKD(c) groups over time (e). Heatmap showing relative expression (2Δ−CT) of anti-(IL-10, CD163, CD206) and pro-inflammatory (CCR7, TNFα, MCP1) genes in graft sections in 2, 4, 8, and 12 week explant from sham and CKD animals. Abdominal aorta sections from Sham and CKD animals as controls. No detected expression in black (f). Scale bars represent 50 μm. Mean±SEM. *p < 0.05; **p < 0.01.

