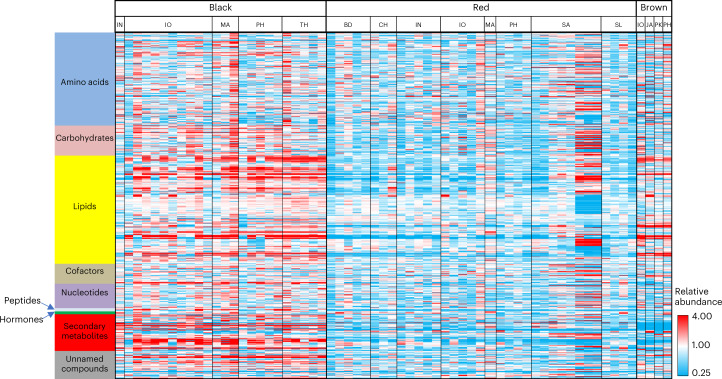
Fig. 2. Global non-targeted metabolic screening of pigmented rice.
Heat map visualization of differences in the median-scaled relative abundance of the identified metabolites in pigmented rice. Each cell represents a specific metabolite. Red cells indicate abundances higher than the median value, while blue cells indicate abundances below the median; white cells are abundances similar to the median. IN, India; IO, Indonesia; MA, Malaysia; PH, Philippines; TH, Thailand; BD, Bangladesh; CH, China; SA, Saudi Arabia; SL, Sri Lanka; JA, Japan; PK, Pakistan.

