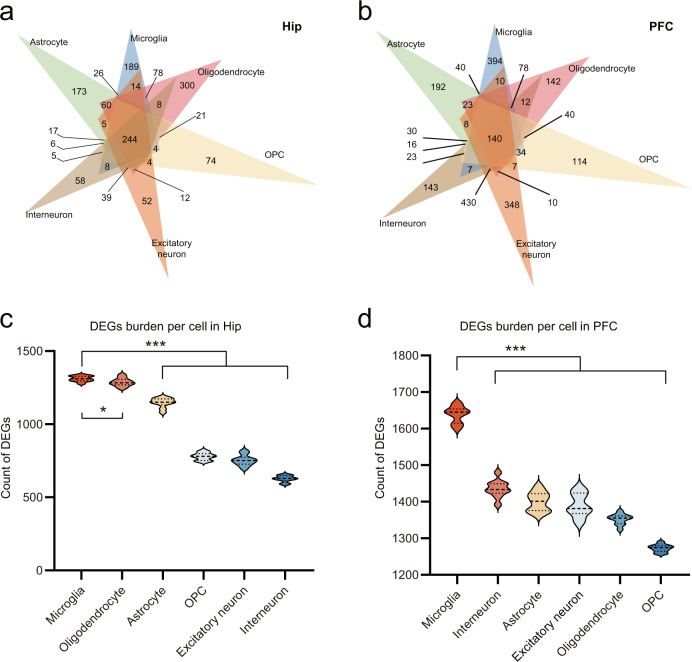
Fig. 2. Gut microbiota mainly affected microglia in the two brain regions.
a, b Venn diagrams describe 846 and 1333 cell-specific DEGs across six major cell types in the Hip (a) and PFC (b). c DEGs (GF vs. SPF) downsampling analysis showed greater microglial gene dysregulations in the Hip (10 times repetition; Microglia vs Astrocyte, ***P = 4.9471E–11, Microglia vs Oligodendrocyte, *P = 0.0395, Microglia vs OPC, ***P = 3.4168E–21, Microglia vs Excitatory neuron, ***P = 1.0866E–19, Microglia vs Interneuron, ***P = 6.7238E–24; P values are from two-tailed Student’s t-test). d DEGs (GF vs. SPF) downsampling analysis showed greater microglial gene dysregulations in PFC, Microglia vs Astrocyte, ***P = 2.5005E–14, Microglia vs Oligodendrocyte, ***P = 1.1953E–17, Microglia vs OPC, *P = 4.019E–20, Microglia vs Excitatory neuron, ***P = 1.1021E–13, Microglia vs Interneuron, ***P = 1.562E–13; 10 times repetition; P values are from two-tailed Student’s t-test).

