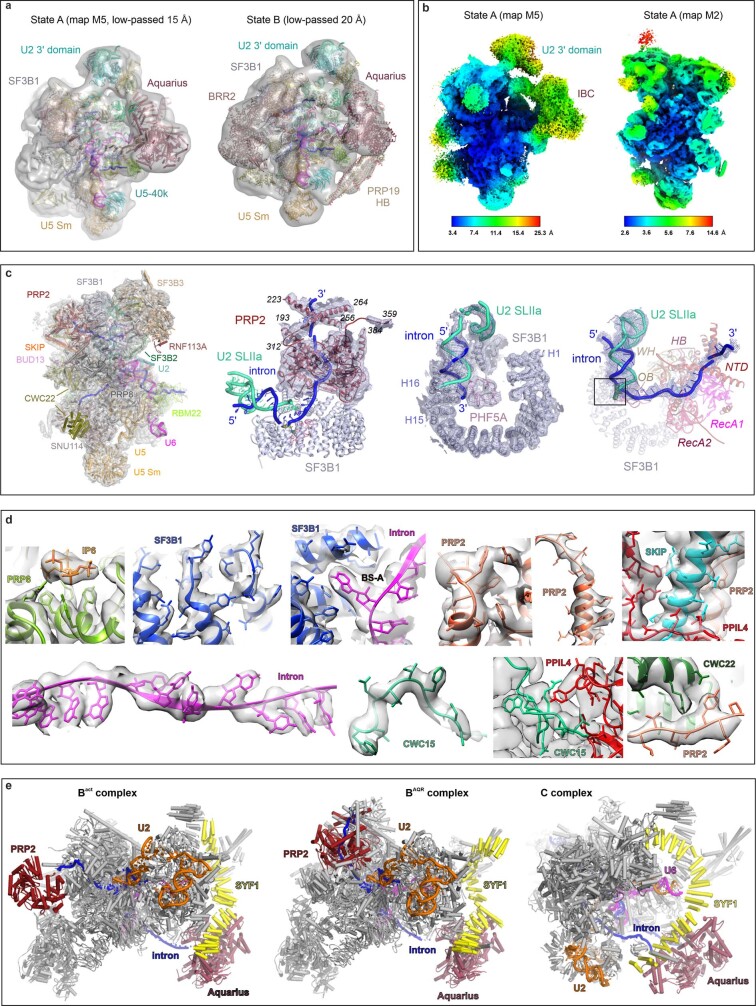
Extended Data Fig. 3. Cryo-EM maps and structure of the BAQR spliceosome.
a, Overall maps of state A and B complexes depicted together with the final model. b, Local resolution of the state A maps, estimated in RELION and visualized in ChimeraX. c, Cryo-EM density snapshots. Various subunits are colored and labeled. d, Selected snapshots of modeled BAQR subunits are depicted together with the unsharpened map of the core region of the complex (map M2). e, Structural comparison between Bact, BAQR, and C complexes. PRP2, Aquarius, SYF1, the U2 snRNA, and the pre-mRNA substrate are colored and labeled. Note the large-scale repositioning of the PRP2 RNA helicase during the conversion of Bact to BAQR, and of the helicase Aquarius during the transition of Bact/BAQR complexes to the C-stage spliceosome.

