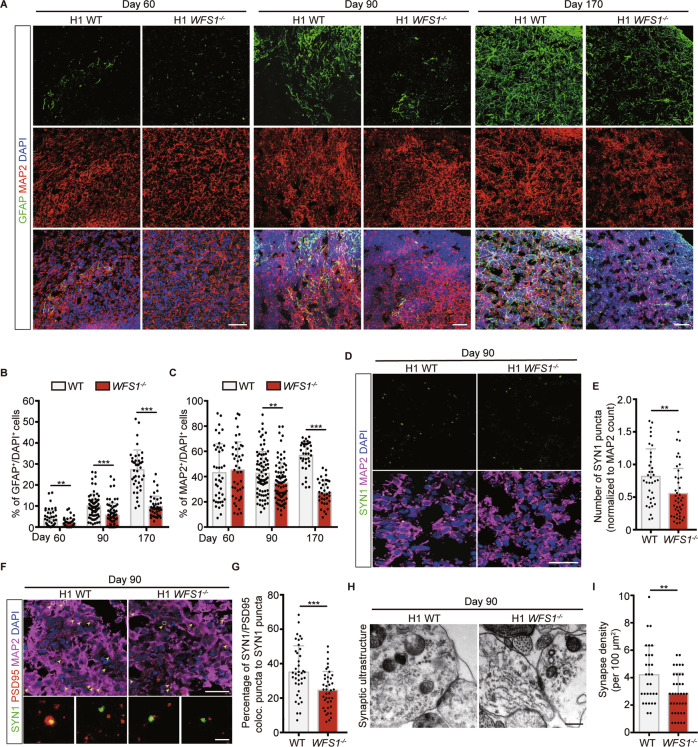
Fig. 2. WFS1 deficiency reduces astrocytes population and impairs synapse formation in cerebral organoids.
A Immunostaining for GFAP (green), MAP2 (red) and DAPI (blue) in WT and WFS1−/− cerebral organoids at Day 60, Day 90 and Day 170. Scale bar, 50 μm. B, C Quantification of the percentage of GFAP+ and MAP2+ cells among the total number of DAPI+ cells in WT and WFS1−/− cerebral organoids at Day 60, Day 90 and Day 170, n ≥ 3 individual organoids. D Immunostaining for the presynaptic marker Synapsin 1 (SYN1) (green) and MAP2 (magenta) in WT and WFS1−/− cerebral organoids at Day 90. Scale bar, 25 μm. E Quantification of the number of SYN1 puncta normalized to MAP2 count in WT and WFS1−/− cerebral organoids at Day 90, n = 3 individual organoids. F Immunostaining for the SYN1 (green), postsynaptic marker PSD95 (red) and MAP2 (magenta) in WT and WFS1−/− cerebral organoids at Day 90. Scale bar, 25 μm. Arrowheads indicate colocalization of SYN1 and PSD95. Lower panels are magnified views of the boxed region in the upper panel. Scale bar, 2 μm. G Quantification of the percentage of SYN1/PSD95 colocalized puncta to SYN1 puncta count in WT and WFS1−/− cerebral organoids at Day 90, n = 3 individual organoids. H Representative images of electron microscopy of synaptic ultrastructure in WT and WFS1−/− cerebral organoids at Day 90. Scale bar, 400 nm. I Quantification of the number of synapse structure normalized to area (100 μm2) in WT and WFS1−/− cerebral organoids at Day 90, n = 3 individual organoids. Data are presented as mean ± SD. p values calculated by unpaired two-tailed Student’s t test were *p < 0.05, **p < 0.01, and ***p < 0.001.

