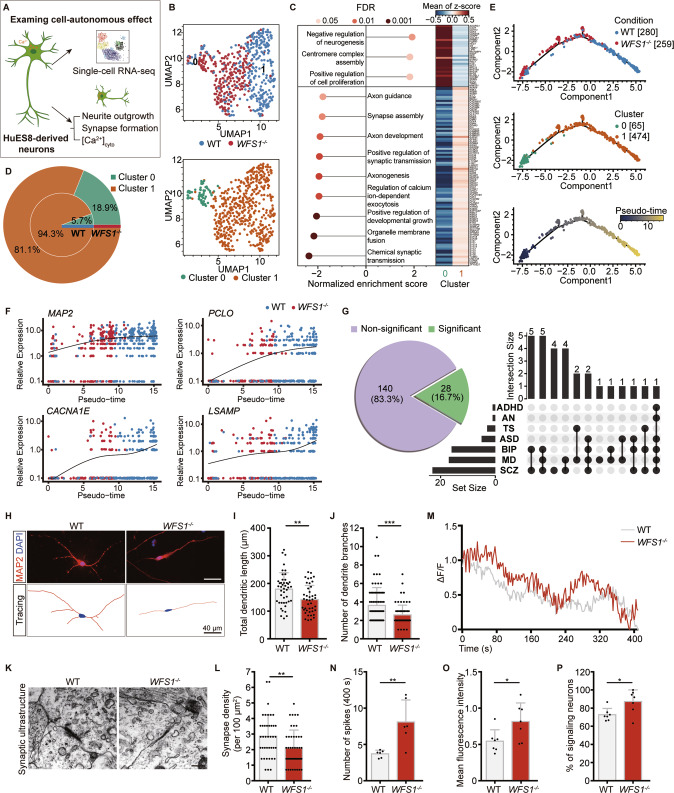
Fig. 3. WFS1 deficiency autonomously delays neuronal differentiation and impairs synapse formation.
A Schematic of the strategy of investigating the cell-autonomous effect of WFS1 deficiency in neurons. B UMAP plot of scRNA-seq data of 539 neurons that passed quality control. Each dot represents a single neuron. Cells are color coded for the corresponding conditions (WT or WFS1−/−, the top panel) and clusters (cluster 0 and 1, the bottom panel). C Dot plot showing significantly enriched GO terms of two clusters (left). GO terms with positive normalized enrichment scores (NES) mean they are enriched in cluster 0 and those with negative NESs mean they are enriched in cluster 1. And heatmap displaying the differentially expressed genes in the leading-edge genes of these terms (right). D Nested pie chart showing the difference in the proportion of cells in two clusters between WT and WFS1−/− neurons. E Principal graph of constructed trajectory of WT and WFS1−/−neurons. Each dot represents a single neuron. Cells are color coded for the corresponding conditions (WT or WFS1−/−, the top panel), clusters (cluster 0 and 1, the middle panel) and inferred pseudo-time (the bottom panel). F Scatter plot of expression of genes over pseudo-time. MAP2, a marker gene of neuron. PCLO, CACNA1E, LSAMP are genes associated with psychiatric disorder. The black curve is the fitted curve, representing the trend of expression changes over pseudo-time. G Pie chart showing that among the genes related to psychiatric disorders, genes significantly correlated with pseudo-time account for 16.7% (28 out of 168). UpSet plot depicting overlap of genes which are both seven psychiatric disorders-associated and significantly pseudo-time correlated. ADHD attention-deficit/hyperactivity disorder, AN anorexia nervosa, TS Tourette syndrome, ASD autism spectrum disorder, BIP bipolar disorder, MD major depression, SCZ schizophrenia. H Immunostaining for MAP2 (red) and DAPI (blue) in WT and WFS1−/− neurons. Scale bar, 40 μm. Lower panels are the corresponding tracings of WT and WFS1−/− neurons. Scale bar, 40 μm. I, J Quantification of the total dendritic length (μm) and the number of dendrite branches, n = 4 independent experiments. K Representative images of electron microscopy of synaptic ultrastructure in WT and WFS1−/− neurons. Scale bar, 400 nm. L Quantification of the number of synapse structure normalized to area (100 μm2) in WT and WFS1−/− neurons, n = 3 independent experiments. M Representative singlecell traces of intracellular spontaneous calcium activity of WT and WFS1−/− neurons. ΔF/F indicates the changes in fluorescence intensity reflecting cytosolic calcium activity in neurons. Intracellular spontaneous calcium activity analysis shown as calcium spike frequency (N), mean fluorescence intensity (O) and the percentage of signaling neurons (P) in WT and WFS1−/− neurons, n = 6 fields from 3 independent experiments. Data are presented as mean ± SD. p values calculated by unpaired two-tailed Student’s t test were *p < 0.05, **p < 0.01, and ***p < 0.001.

