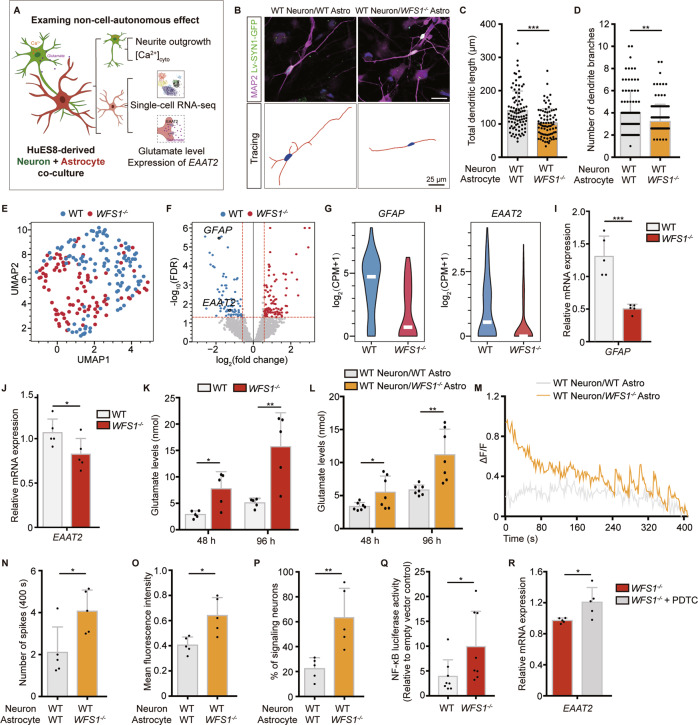
Fig. 4. Astrocytic WFS1 deficiency impairs neurite outgrowth in non-cell-autonomous manner.
A Schematic of the strategy of investigating the non-cell-autonomous effect of WFS1−/−astrocytes. B Representative images of co-culture of WT/WFS1−/− astrocytes and WT neurons, neurons labeled with lentivirus SYN1::GFP were stained with MAP2 (magenta). Scale bar, 25 μm. Lower panels are the corresponding tracings of neurons. Scale bar, 25 μm. C, D Quantification of the total dendritic length (μm) and the number of dendrite branches, n = 3 independent experiments. E UMAP plot of scRNA-seq data of 207 astrocytes that passed quality control. Each dot represents a single cell. Cells are color coded for the corresponding conditions (WT or WFS1−/−). F Volcano plot depicting differential gene analysis between WT and WFS1−/− astrocytes. Dots of color indicate differentially expressed genes, that is, those with |log2FC | > 0.58 and FDR ≤ 0.05 (red for up- and blue for down-regulated genes in WFS1−/− astrocytes). G, H Violin plots displaying the expression of GFAP and EAAT2 in WT and WFS1−/− astrocytes. The y-axis shows the log-transformed normalized read count. I, J Quantitative real-time PCR analysis of GFAP and EAAT2 in WT and WFS1−/− astrocytes, n = 5 independent experiments. K Glutamate levels (nmol) at 48 h and 96 h in WT and WFS1−/− astrocytes culture, n = 5 independent experiments. L Glutamate levels (nmol) at 48 h and 96 h in co-culture of WT neurons and WT/WFS1−/− astrocytes, n = 7 independent experiments. M Representative single cell traces of intracellular spontaneous calcium activity of WT neurons co-cultured with WT/WFS1−/− astrocytes. Intracellular spontaneous calcium activity analysis shown as calcium spike frequency (N), mean fluorescence intensity (O) and the percentage of signaling neurons (P) in WT neurons co-cultured with WT/WFS1−/− astrocytes, n = 5 fields from 3 independent experiments. Q NF-κB luciferase activity in WT and WFS1−/− astrocytes, relative to empty vector control group, n = 8 independent experiments. R Quantitative real-time PCR analysis of EAAT2 in WFS1−/− astrocytes and NF-κB inhibitor PDTC treated-WFS1−/− astrocytes, n = 5 independent experiments. Data are presented as mean ± SD. p values calculated by unpaired two-tailed Student’s t test were *p < 0.05, **p < 0.01, and ***p < 0.001.

