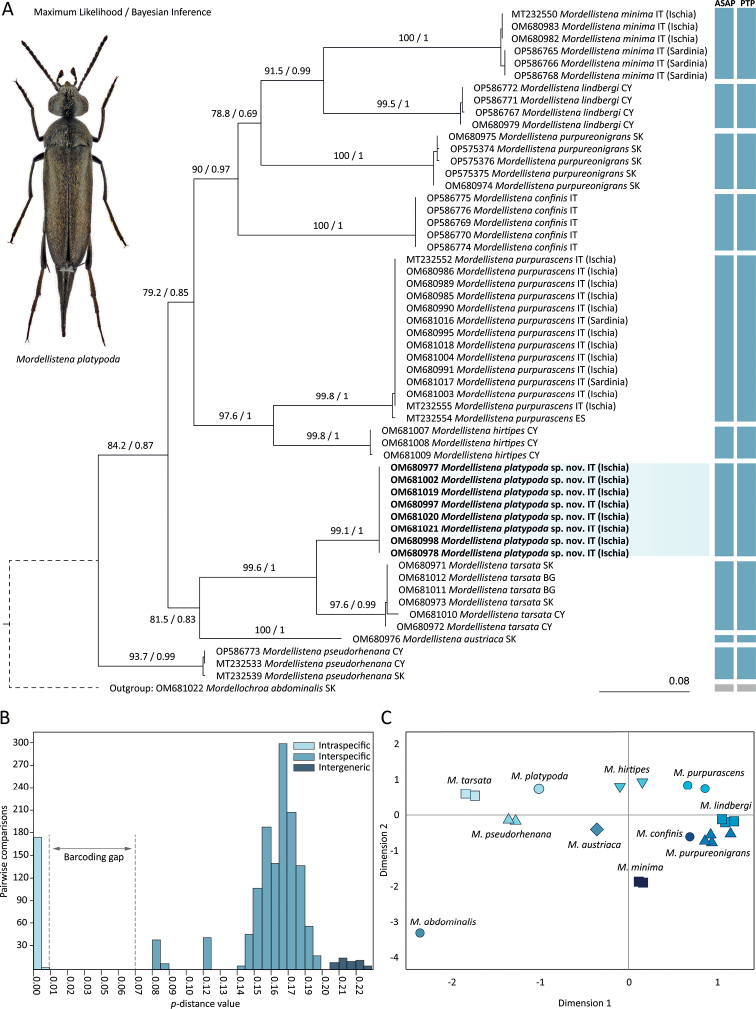
Figure 2.
Analyses of a 658 bp fragment of the cytochrome c oxidase subunit I gene (COI) in selected Mordellistena A. Costa, 1854 species A combined results of maximum likelihood (ML) and Bayesian inference (BI) analyses; ML bootstrap values and BI posterior probabilities are shown on ML tree. The vertical bars represent results of Assemble Species by Automatic Partitioning (ASAP) and Poisson Tree Processes (PTP) species delimitation analyses B distribution of uncorrected p-distances C multidimensional scaling of uncorrected p-distances.

