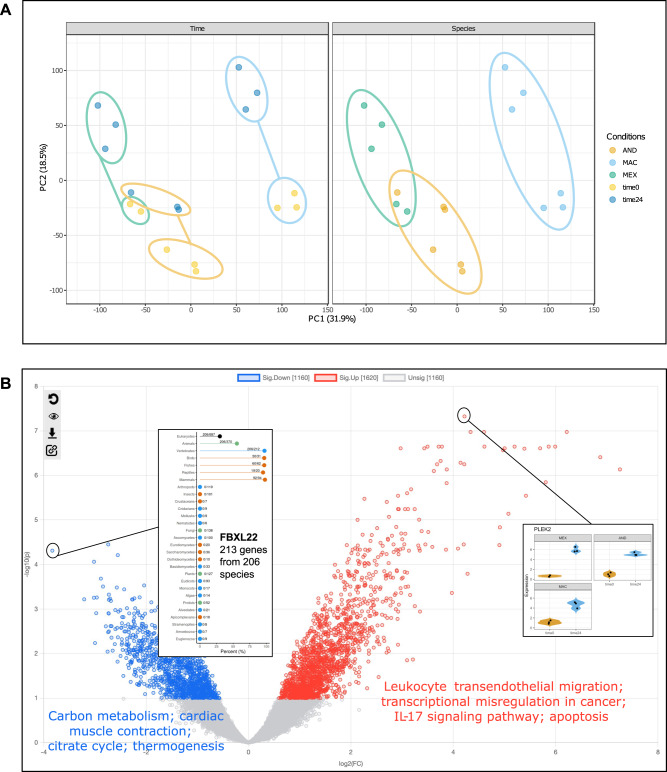
Fig. 4. Non-model organism case study results.
A PCA of normalized count tables for the salamander data, with samples annotated by time since amputation (time0 = yellow, time24 = dark blue), and species (AND = orange, MAC = light blue, MEX = green). B Volcano plot showing differentially expressed genes with log2FC on the x-axis and unadjusted p-value on the y-axis. Genes are colored red if their adjusted p-values < 0.05 and log2FCs > 0 and blue if their adjusted p-values < 0.05 and log2FCs < 0. P-values were calculated with the limma R package, which uses a moderated t-statistic (two-sided). Gene-specific details are displayed for PLEK2 (violin plot; time0 = orange, time24 = blue) and FBXL22 (species-hits plot). All plots were generated by ExpressAnalyst.

