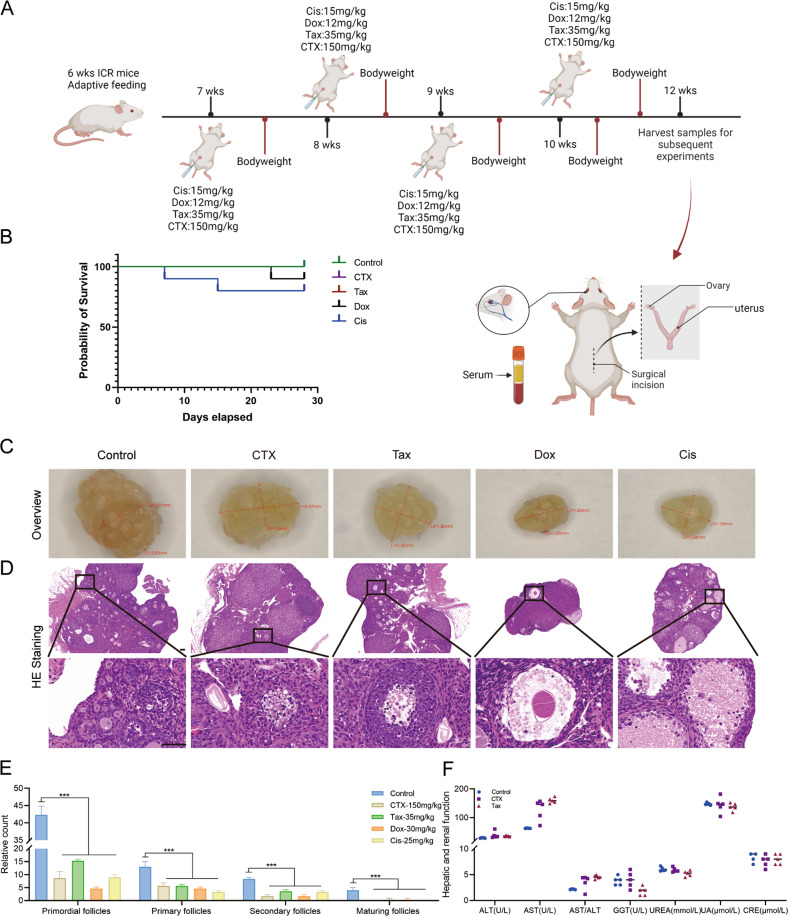
Fig. 2. Chemotherapeutic agents induced acute ovarian injury.
A The flowchart of the experimental procedure. The mice in each group received CTX, Tax, Dox, or Cis, respectively, once a week for four consecutive 4 weeks from 7 to 10 weeks. All mice were sacrificed at 12 week-age. n = 10 mice/group. B Kaplan–Meier survival curves were used to record the survival of the mice during the agent administration. C The ovarian macrostructure was observed under visible light. D Representative images of H&E staining of ovarian micromorphology after treatment with chemotherapeutic agents. Scale bars = 100 μm. n = 5 (independent experiments). E The quantities of primordial, primary, secondary, and maturing follicles per slide in each group were analyzed. n = 5 (independent experiments). F Conventional biochemical methods were used to detect the activity of levels of ALT, AST, GGT UREA, UA, and CRE in the serum of mice. n = 5 (independent experiments). ***p < 0.001.

