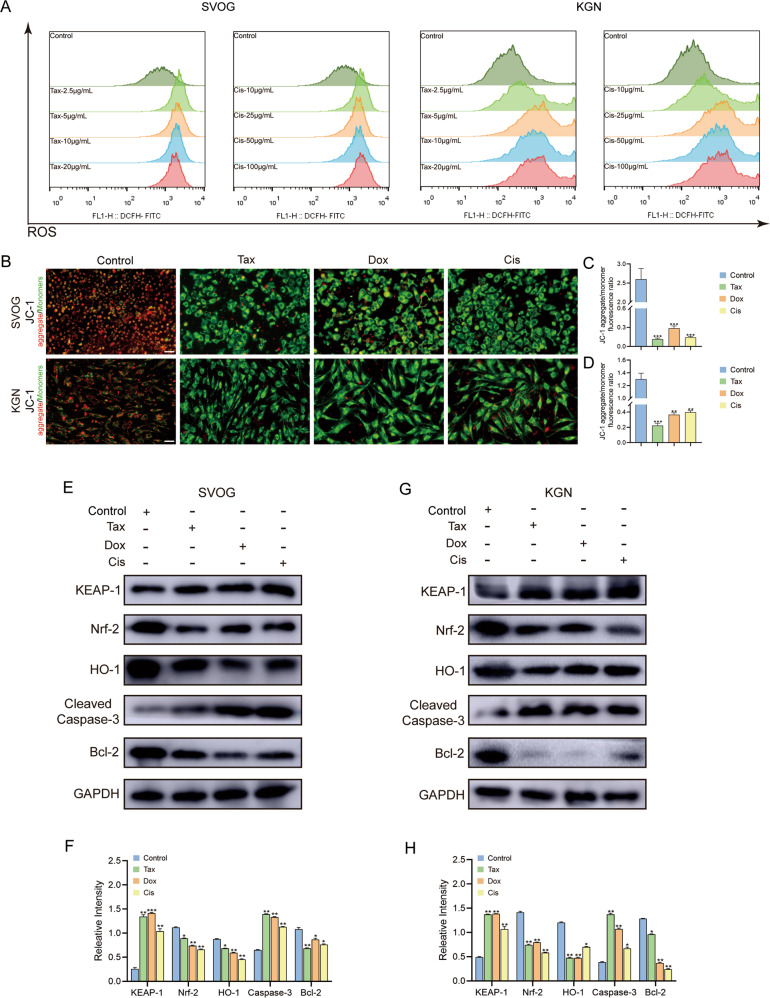
Fig. 4. Chemotherapeutic agents induced apoptosis of ovarian GCs through oxidative stress.
A ROS assay to evaluate the intracellular ROS levels of SVOG and KGN cells after Tax (0, 2.5, 5, 10, 20 μg/ml) or Cis (0, 10, 25, 50, 100 μg/ml) treatments for 24 h. B–D SVOG and KGN cells were treated with Tax (5 μg/ml), Dox (10 μg/ml), or Cis (25 μg/ml) for 24 h and then stained with JC-1 (red for aggregate, green for monomer). Scale bar = 10 μm. The JC-1 aggregate/monomer fluorescence ratio was quantified for SVOG (C) and KGN (D) cells. n = 3 (independent experiments). E, G The protein levels of KEAP-1, Nrf-2, HO-1, Cleaved Caspase-3, and Bcl-2 were examined using Western blot analysis in SVOG (E) and KGN (G) cells. F, H Quantitative analysis of the targeted protein expressions. n = 3 (independent experiments). *p < 0.05, **p < 0.01, ***p < 0.001.

