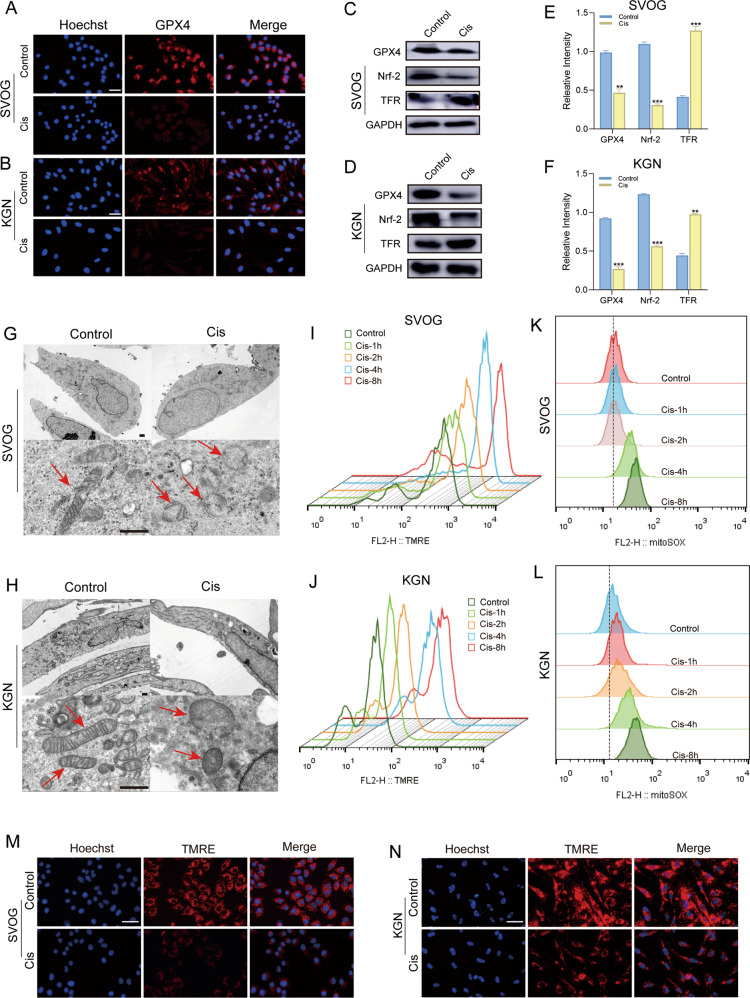
Fig. 6. Cis-induced ferroptosis through mitochondrial dysfunction and impaired antioxidant capacity.
A, B Assessment of GPX4 expression in SVOG (A) and KGN (B) cells treated with Cis (25 μg/ml) for 24 h. Scale bar = 10 μm. C, D The protein levels of GPX4, Nrf-2, and TFR were examined using Western blot analysis in SVOG (C) and KGN (D) cells treated with Cis (25 μg/ml) for 24 h. E, F Quantitative analysis of the targeted protein expressions. n = 3 (independent experiments). *p < 0.05, **p < 0.01, ***p < 0.001. G, H Representative cell and mitochondrial ultrastructural images of SVOG (G) and KGN (H) cells exposed to Cis (25 μg/ml) for 24 h. Scale bar = 5 μm. I, J TMRE assay to evaluate the MMP levels of SVOG (I) and KGN (J) cells after Cis (25 μg/ml) treatment for 1, 2, 4, and 8 h by flow cytometry. K, L MitoSOX assay to evaluate mitochondrial ROS levels of SVOG (K) and KGN (L) cells after Cis (25 μg/ml) treatment for 1, 2, 4, 8 h by flow cytometry. M, N Representative images of TMRE staining indicated MMP levels of SVOG (M) and KGN (N) cells after Cis (25 μg/ml) treatment for 24 h. **p < 0.01, ***p < 0.001.

