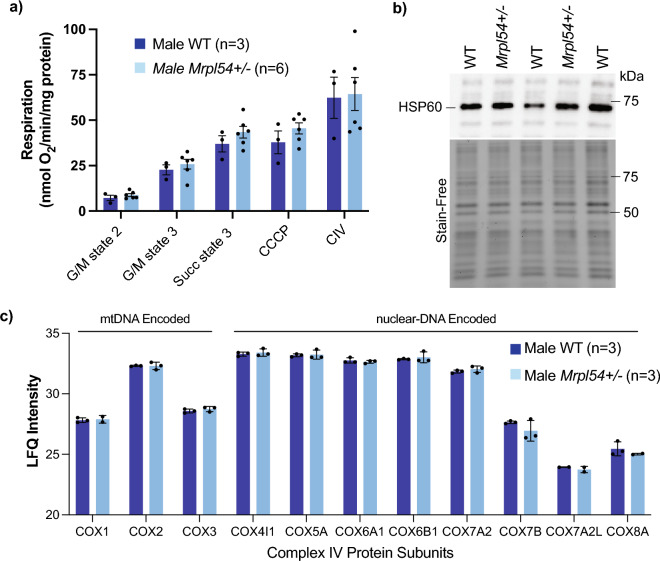
Figure 5.
Biochemical profiling of Mrpl54+ / − and wild type mouse liver. (a) Oxygraph respiration analysis of isolated liver mitochondria showed no difference in state 2, state 3, or maximal respiration between Mrpl54+/− (n = 6) and WT (n = 3). (b) Semiquantitative western blot analysis of HSP60 expression in isolated liver mitochondria showed no difference between Mrpl54+/− (n = 2) and WT (n = 3). (c) Mass spectrometry analysis of protein from isolated liver mitochondria showed no difference between levels (label-free quantification, LFQ) of nDNA- and mtDNA-encoded protein subunits of ETC complex IV between Mrpl54+/− (n = 3) and WT (n = 3). Graphs show mean ± SEM; male WT (blue); male Mrpl54+/− (light blue).

