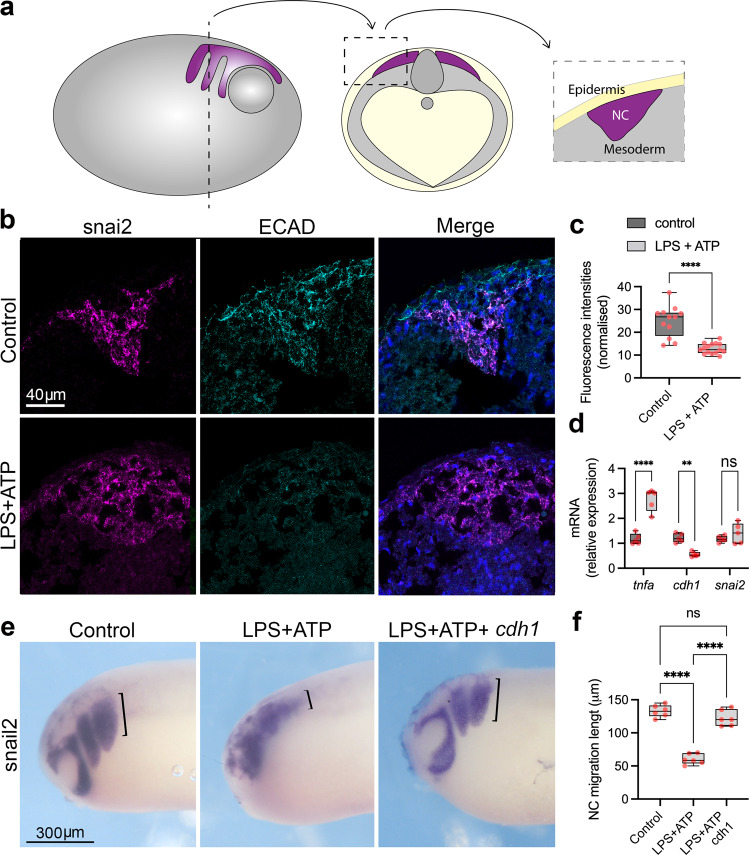
Fig. 3. Pro-inflammatory activation leads to E-cadherin downregulation in the neural crest.
a Scheme of cryosections for immunofluorescence in the neural crest, in which embryos were sectioned about 300um from the anterior end. Neural crest is represented in purple, mesoderm in grey and epidermis in yellow. b snai2 fluorescent ISH (magenta) combined with E-cadherin (ECAD) immunofluorescence (cyan) depicting ECAD levels in the neural crest in control and LPS + ATP conditions. Merged images with DAPI (blue). E-cadherin signal is reduced on the snai2 positive area in LPS + ATP treated embryos. c Quantification of E-cadherin fluorescence shown in b (Control n = 12, LPS + ATP n = 15, p < 0.0001). d qPCR quantification of tnfa, cdh1 and snai2 expression levels in neural crest explants from control (n = 5) and LPS + ATP (n = 5) treated embryos, showing significant upregulation of tnfa (p < 0.0001), significant downregulation of cdh1 (p = 0.0031) and non-significant changes in snai2 (p = 0.5290) (Two-way ANOVA). e snai2 ISH evidencing neural crest migration in control, LPS + ATP and LPS + ATP+cdh1 mRNA. cdh1 mRNA injections can partially rescue impaired neural crest migration caused by LPS + ATP pro-inflammatory activation. Neural crest migration lengths are evidenced by black brackets. f Neural crest migratory phenotype rescue in LPS + ATP (N = 6) and LPS + ATP+cdh1 mRNA (N = 6) embryos, with significant higher rescue frequencies in LPS + ATP+cdh1 mRNA (p < 0.0001, one-way ANOVA). *p < 0.05, **p < 0.01, ***p < 0.001 and ****p < 0.0001. Boxplots centre is the median, with bounds representing the 25th and 75th percentile, with and whiskers as minima to maxima. Source data are provided as a Source Data file.

