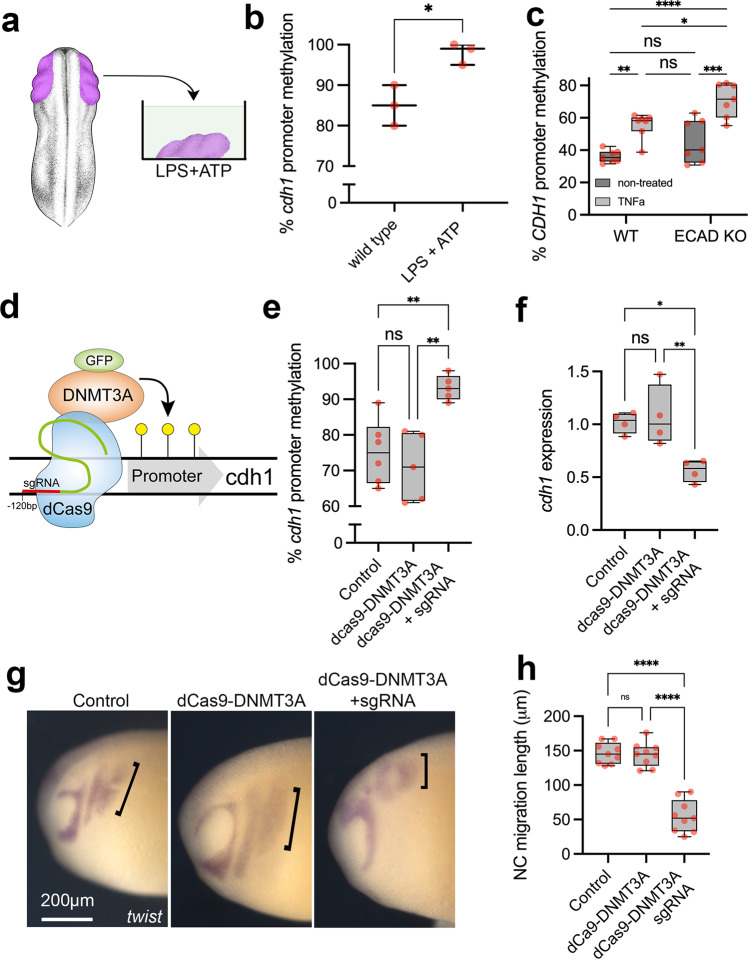
Fig. 6. CDH1 promoter hypermethylation is induced by pro-inflammatory activation and is sufficient to impair neural crest migration.
a Illustration of neural crest pro-inflammatory activation using neural crest explants and LPS + ATP treatment. Xenopus illustrations © Natalya Zahn (2022). b Average percentage of cdh1 promoter methylation in neural crest explants from wild type and LPS + ATP conditions (N = 3 explants pools per group, n = 10 explants per point). cdh1 promoter methylation is significantly increased by ~15% in LPS + ATP treated samples in comparison to controls (p = 0.0164, two-sided Welch’s t test). Data are presented as mean values and minimum to maxima. c Average percentage of CDH1 promoter methylation in hiNCCs under wild type (WT), TNFa, ECAD KO or ECAD KO + TNFa conditions, showing significant CDH1 promoter methylation in TNFa exposed hiNCCs (n = 7 per group; p = 0.0048) and ECAD KO + LPS + ATP in comparison to ECAD KO (p = 0.0002). Two-way ANOVA. d Illustration of dCas9-DNMT3A-GFP system. e Average percentage of cdh1 promoter methylation in neural crest explants from control (non-injected, N = 6), dCas9-DNMT3A-GFP (N = 5) and dCas9-DNMT3A-GFP + sgRNA (N = 5) injected embryos. cdh1 promoter methylation is increased in dCas9-DNMT3A-GFP + sgRNA injected neural crest in comparison to controls (p = 0.0035, Two-way ANOVA). f cdh1 levels in the neural crest from control, dCas9-DNMT3A-GFP and dCas9-DNMT3A-GFP + sgRNA injected embryos, with reduction in dCas9-DNMT3A-GFP + sgRNA in comparison to controls (p = 0.009). N = 4 per group, pool of neural crest explants n = 10 per point. Two-way ANOVA. g twist ISH in Xenopus embryos displaying neural crest migration in control, dCas9-DNMT3A-GFP and dCas9-DNMT3A-GFP + sgRNA injected embryos. Neural crest migration is evidenced by black brackets. h Neural crest migration quantification in control, dCas9-DNMT3A-GFP and dCas9-DNMT3A-GFP + sgRNA injected embryos, showing reduction in dCas9-DNMT3A-GFP + sgRNA in comparison to controls (p = 0.002). n = 9 per group, Two-way ANOVA. Boxplots centre is the median, with bounds representing the 25th and 75th percentile, with and whiskers as minima to maxima. Source data are provided as a Source Data file. *p < 0.05, **p < 0.01, ***p < 0.001 and ****p < 0.0001.

