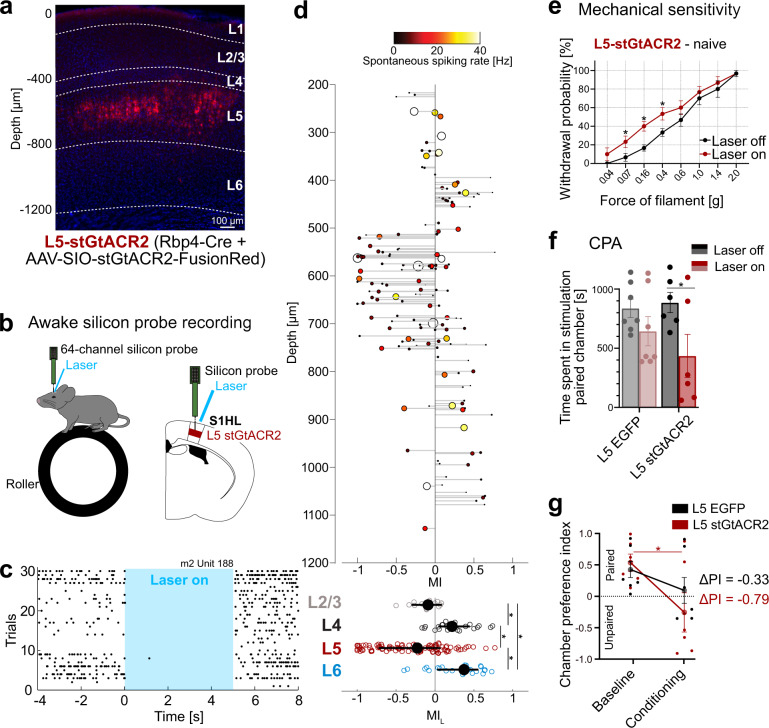
Fig. 5. Layer 5 (L5) inhibition in the S1 hindlimb cortex (S1HL) reproduces pronociceptive effects of Layer 6 corticothalamic (L6-CT) activation.
a stGtACR2-FusionRed-expression (red) in L5 S1HL of an Rbp4-Cre mouse showing fluorescence in L5 neurons, S1HL layer borders (dashed lines), estimated based on soma sizes and densities using DAPI signals (blue). A representative example from n = 15 mice. b Schematic of silicon-probe recordings in S1HL in a head-fixed awake mouse (upper); example raster demonstrating inhibition of spiking in an example L5 unit (lower). c Example raster for a laser-suppressed L5 stGtACR2 unit (depth = 589 μm). d Upper panel: depth-resolved light modulation indices (MIL) for L2/3, L4, L5, and L6 units in S1HL during optogenetic inhibition of L5 (n = 3 pooled experiments, 285 units). Each unit is represented by one data point; the size and color of markers are proportional to the spontaneous spiking rate (black to yellow: low to high). Depth values are slightly jittered for visibility. Non-significantly modulated units are not shown (122/285). Lower panel: MIL distributions for significantly modulated units by layer. e Within-animal comparison of paw withdrawal probabilities in response to graded von Frey stimulation of the hindpaw at baseline (black, laser off) and during optogenetic inhibition (red, laser on, 5 s continuous pulse) in the contralateral S1HL of L5-stGtACR2 mice (n = 6). f Conditioned place aversion (CPA) test. Population analysis of total time spent in the laser-paired chamber at baseline (Laser off, black/gray) and during inhibition (Laser on, red 20 Hz laser stimulation in S1HL cortex) of L5-EGFP (n = 7) and L5-stGtACR2 (n = 6, p = 0.006) naive mice. g Average chamber preference indices (PI) for L5-stGtACR2 (n = 6) and L5-EGFP (n = 7) mice. A PI of 1 indicates a full preference, while a PI of −1 indicates full avoidance of the laser-paired chamber. PIs were not significantly different between groups during laser stimulation or at baseline. * represent p < 0.05; 5d: two-sided Wilcoxon signed-rank test; see Supplementary Table 1 for population medians and first and third quartiles per layer and condition.; 5e–g: Two-way repeated measures ANOVA with post hoc Bonferroni test. Exact F and p values are in Supplementary Table 1. Data were shown as mean ± SEM. Source data for c–g are provided as a Source Data file.

