

Abstract
Single-particle electron cryo-microscopy (cryo-EM) has become an effective and straightforward approach to determine the structure of membrane proteins. However, obtaining cryo-EM grids of sufficient quality for high-resolution structural analysis remains a major bottleneck. One of the difficulties arises from the presence of detergents, which often leads to a lack of control of the ice thickness. Amphipathic polymers such as amphipols (APols) are detergent substitutes, which have proven to be valuable tools for cryo-EM studies. In this work, we investigate the physico-chemical behavior of APol- and detergent-containing solutions and show a correlation with the properties of vitreous thin films in cryo-EM grids. This study provides new insight on the potential of APols, allowing a better control of ice thickness while limiting protein adsorption at the air-water interface, as shown with the full-length mouse serotonin 5-HT3A receptor whose structure has been solved in APol. These findings may speed up the process of grid optimization to obtain high-resolution structures of membrane proteins.
Keywords: air-water interface, amphipol, detergent, ice thickness, membrane proteins, particle orientation
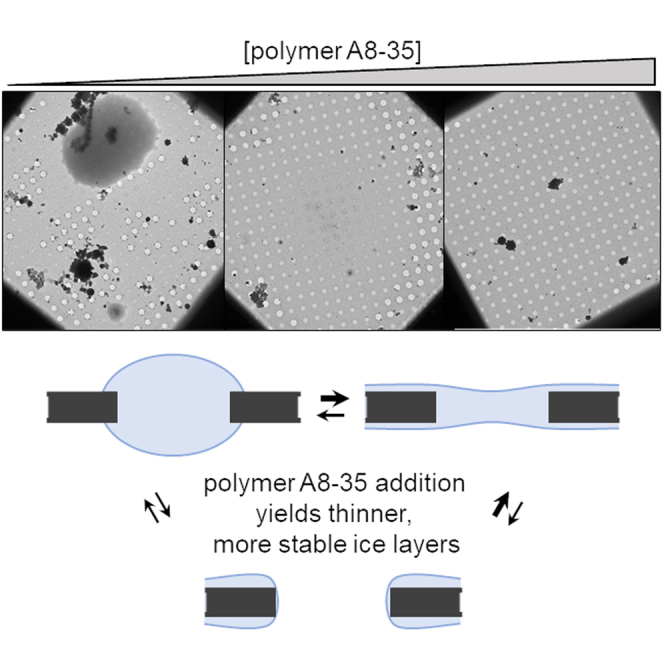
Graphical abstract
Significance
A major challenge in structural biology is to obtain high-resolution structures of membrane proteins (MPs). The preparation of electron cryo-microscopy (cryo-EM) grids containing the MPs to be imaged, evenly distributed and randomly oriented in a thin enough layer of ice, by blotting-plunge-freezing process requires both a lot of precious sample and microscope time. The present study provides a comprehensive insight regarding physical mechanisms at work during cryo-EM grid preparation in the presence of surfactants in solution. The results suggest that the quality of cryo-EM specimens can be understood from a physico-chemical characterization of liquid films and interfaces to complement the empirical optimization of the grid preparation. Comprehension of the system allowed us to improve imaging of a model mammalian MP.
Introduction
Membrane proteins (MPs) are essential to cellular functions. Obtaining their atomic structures extends our understanding of how MPs function and can contribute to developing novel therapies. The “resolution revolution” in single-particle electron cryo-microscopy (cryo-EM) (1,2,3) marked a turning point in structural biology and began with the landmark structure of the transient receptor potential cation channel V1 (TRPV1) (4) stabilized in an amphipathic polymer, called amphipol (APol) (5,6,7). Since then, more than one thousand MP structures obtained in different amphipathic environments (detergents, APols, or nanodiscs) (8) have been reported in the Protein Data Bank (9). However, cryo-EM study of MPs remains complicated.
The main limiting factors are the difficulty to 1) produce MP samples and 2) trap the particles to be imaged in an ice layer of controlled thickness, without denaturing the protein nor favoring one type of orientation. The preparation of cryo-specimens involves blotting the sample excess deposited on the grid by pressing absorbent filter paper against the surface of the grid and flash-freezing (vitrifying) the grid by immersion into a cryogen (10, 11). Despite the emergence of devices to avoid the hard-to-standardize contact with a filter paper (12,13,14,15), this approach is still by far the most common. General advice might be shared (16,17,18), but factors that influence the formation of stable cryo-films of desired thickness with evenly distributed and randomly oriented MPs are difficult to control (19, 20). Empirical sample-specific optimization remains the only way to overcome the poor reproducibility of the grid characteristics.
In MP samples, the presence of an excess of detergent molecules, mandatory to prevent MP aggregation, further complicates the obtention of good quality cryo-EM specimens. The detergent molecules adsorb at the gas-liquid interface, which tends to stabilize thinner films (21). On the one hand, this can be advantageous since films that are too thick limit the resolution of the three-dimensional (3D) reconstruction. On the other hand, thin films are more fragile and can break. They can also lead to uneven MP distribution through the ice layer with an exclusion of MPs from the film center and their concentration on the edges of the holes (16). Additionally, detergent molecules at the air-water interface can limit protein adsorption at this interface (19). The question of finding a compromise between the different and opposing effects of detergent adsorption at the air-water interface is thus crucial. The presence of detergent micelles in the bulk solution can also increase the noise in the image background (18). Resorting to detergents with different critical micelle concentrations (CMCs) or replacing detergents for other amphipathic environments such as nanodiscs or APols, in order to work without any surfactant in the solution, is also often employed as an alternative to optimizing cryo-EM specimen preparation.
Herein, we address these challenges by investigating the impact of surfactants on aqueous thin film stability and thickness. We focused on two types of surfactants, which differ significantly from each other: a small detergent largely used in MP biochemistry, dodecyl-β-D-maltoside (DDM) (22), and a hydrophobically modified poly(acrylic acid) polymer, called APol A8-35 (23). If DDM is a nonionic detergent, APol A8-35 is a negatively charged polymer with an average molecular mass nearly 10 times that of DDM. These two surfactants were also chosen based on their wide use in cryo-EM. A recent quantitative analysis of all MP cryo-EM structures deposited in the Protein Data Bank revealed that DDM is one of the most widely used detergents for structure determination of MPs by cryo-EM (8). Strikingly, it is also the detergent the most frequently replaced by another amphipathic environment before vitrification. APols are also substantially used in cryo-EM as they belong to the six most frequently used surfactants in which MP structures have been established (8). Moreover, previous studies reported that improved cryo-EM images were obtained after replacing classical detergents by APol A8-35 (24, 25) or adding APol A8-35 as an additive in either soluble protein (26, 27) or nanodiscs-reconstituted MP samples (28). Therefore, we investigated the physico-chemical properties of solutions containing A8-35 as a function of polymer concentration, and we compared the data with those of DDM. We measured 1) macroscopic liquid film lifetime to assess their stability and 2) the dynamic surface tension to access the timescale necessary for surfactants to reach the air-water interface (focusing on short times to mimic conditions for cryo-EM grid preparation). We show that the physico-chemical behavior of APol-containing solutions is correlated with ice film properties in cryo-EM grids. This yielded sufficient comprehension to improve imaging of a model mammalian MP, the full-length mouse serotonin 5-HT3A receptor (m5-HT3AR), which belongs to the large family of pentameric ligand-gated ion channels and is involved in multiple neurologic disorders (29). A few years ago, its cryo-EM structure was resolved at high resolution in the presence of C12E9, a polyoxyethylenglycol-based detergent (30). Based on our finding on the physico-chemical study of APol-containing solutions, we show that the addition of APol at defined concentrations in MP/APol samples before vitrification can significantly reduce protein adsorption at the air-water interface, which results in a more isotropic distribution of protein orientations allowing 3D reconstruction.
Materials and methods
Chemicals
APol A8-35 and DDM were obtained from Anatrace (USA). A8-35 was dispersed in water and lyophilized before use, whereas DDM was used as received.
Trizma base and sodium chloride were obtained from Sigma Aldrich, hydrochloric acid 37% from VWR, and ultrapure water (resistivity of 18.2 MΩ⋅cm) obtained with a MilliQ system (Merck Millipore). APol and DDM solutions were prepared with Tris/NaCl buffer (Tris 20 mM, NaCl 150 mM, pH 8.0). All newly prepared surfactant solutions were stirred for 1 h at room temperature for proper hydration and homogenization of surfactants.
Film pulling experiments
The liquid film pulling experiments were performed as reported in ref. (21). Briefly, a frame attached to a force captor is plunged into a tank filled with the studied surfactant solution. A motorized downward translation of the tank leads to the generation of a liquid film, supported by the frame. The film rupture is detected through a discontinuous change of the force applied to the frame, allowing an automatization of film generation and film lifetime measurement. All films (300 films per tested concentration) were generated at 2 mm/s, in a sealed box saturated in humidity using a humidity regulator (31).
Surface tension measurements
Surface tension variation over time was measured using a Tracker device (Teclis Scientific, France). Surfactant solutions were characterized in a rising bubble configuration. Two bubbles were first expelled to guarantee a fresh air-water interface. The surface tension variation at the interface of a 5-μL air bubble was then computed in real time based on bubble profile imaging.
Wetting of carbon surfaces
Carbon surfaces were prepared by evaporating carbon on 24 24 mm square cover glasses (ref. COVN-0.24-200 from Labbox, Spain) under reduced pressure. The evaporation was performed using a Leica EM ACE600 (Leica Microsystems, Germany). Double carbon thread was used as a source to deposit a carbon layer of 25.5 ± 0.5 nm, under pressures below 8.0.10−5 mbar. Continuous stage rotation at maximum speed was used to prevent uneven carbon deposit.
Wetting properties were performed at 20°C with a DSA25E drop shape analyzer (Krüss, Germany) on 4.0 μL of surfactant solution deposited on a carbon surface pretreated (or not) with plasma as for cryo-EM grids.
Cryo-EM ice thickness measurements and calculation
R2/2 Cu 200 Quantifoil grids, consisting of a holey 20-nm-thick carbon layer (Quantifoil, Germany), were washed with manual dipping in an ethyl acetate solution and then glow-discharged under Argon atmosphere (0.5 bar, alphagaz 2 grade Ar from Air Liquide) at 5 mA for 30 s, with a Cressington 208 (Cressington, United Kingdom). Grids were used between 30 and 60 min after the glow-discharge. After sample deposition of 3.0 μL of surfactant solutions on the grids, these were blotted (force 15 during 2 s) and plunge-frozen in liquid ethane and cooled-down with liquid nitrogen, in a Vitrobot Mark IV (Thermo Fisher Scientific, USA). There was no pause after each step of the procedure, so that the time elapsed was as short as possible (total time between sample deposition and freezing in liquid ethane was ∼5.5 s and delay between end of blot and freezing <1 s). Blotting papers (Ted Pella, USA) were changed between each set of cryofixation. Chamber environment was set at room temperature (21°C) and 100% humidity. Grids were stored in liquid nitrogen until being imaged.
Surfactant-only cryo-EM observation was performed with a JEM 2010 F (JEOL, Japan), operated at 200 kV equipped with an Ultrascan camera (Gatan, USA). Ice thickness was calculated as follows: low-magnification (LM, 500) images of around 35 squares in each grid were acquired randomly (see atlases in Fig. S1), followed by high-magnification imaging (30,000) of selected holes for which pairs of tilted images (+15°/–15°) were acquired with a constant exposure intensity and a defocus of 3000 nm. This allowed a trigonometric calculation of the ice thickness, based on the change in apparent distances between impurities present on the top and bottom faces of the ice film (Fig. 1). Finally, holes imaged at high magnification for ice thickness calculation were marked for identification by puncture with the focused electron beam.
Figure 1.

Illustration of the thickness measurement approach. (a) Low-magnification (500) image of a grid prepared with a solution containing A8-35 at 0.003 g/L, with highlights on one of the holes used to acquire pairs of tilted images (scale bar: 10 μm). (b and c) Zooms on a pair of high-magnification (30,000) tilted images, acquired at −15° and +15°, respectively (scale bar: 200 nm). (d and e) Zooms on the highlighted regions from (b) and (c), respectively (scale bar: 50 nm). Apparent distances between two impurities adsorbed on each side of the ice film (here, L1 and L2) are measured after projection onto a plane perpendicular to the rotation axis (dashed lines). (f–h) Cartoon-illustrated calculation of the ice thickness. Each cartoon represents the section of an ice film, with impurities adsorbed on both sides. (f) No tilt. (g) Tilt at angle –α. (h) Tilt at angle +α. (For symbols and calculation description, see main text).
Based on a pair of tilted images, acquired at an angle α, ice thickness was determined from cartoons (g) and (h) with Eqs. 1 and 2, respectively:
| (Equation 1) |
| (Equation 2) |
where L1 and L2 are the apparent distances between two impurities adsorbed on each side of the film (tilt-dependent distances, obtained via measurements on micrographs); D is the real distance between impurities (tilt-independent distance); x is the angle between the “impurities axis” and the normal to the film, when there is no tilt.
The subtraction of Eqs. 2 and 1 gives the following:
or
| (Equation 3) |
Finally, from cartoon (f), Eq. 4 was determined:
| (Equation 4) |
where e is the local ice thickness. Hence, the combination of Eqs. 3 and 4 gives:
| (Equation 5) |
The trigonometric considerations detailed above show that if the tilt angle α is known, e can be directly computed from the difference between L1 and L2. Note that the calculation reported here neglects the thickness of impurities. To limit this source of thickness overestimation, only the smallest impurities (apparent diameter <20 nm) were considered for calculations. In addition, all measures were performed close to the hole center, in areas of constant thickness, to exclude any bias linked to nonplanar film geometry.
Considering the number of holes to be visualized, thicknesses were directly estimated from LM images, based on intensity measurements performed with the ImageJ software. Measurements of the mean intensity of ice-containing holes were performed at the center of each hole, in a circular region of diameter 1.6 μm (full hole diameter is 2 μm). This has the advantage of excluding the film edges, where the sharpest thickness variation occurs. The mean intensity of empty holes was also measured to serve as an internal standard in order to detect any tiny beam intensity changes between acquisitions.
Thicknesses calculated from high-magnification images were correlated with intensities measured in the corresponding holes in LM images. This allowed us to plot a calibration curve (Fig. 2). The best fit was obtained by considering a logarithmic relationship between thickness and intensity, in good agreement with previous studies on cryo-EM ice thickness measurements (32, 33). The curve was then used to convert all intensity measures into estimated thicknesses before drawing a grid-scale ice thickness distribution for every observed grid. Distributions were then normalized (matching integrals) to account for a varying number of exploitable holes between grids and conditions.
Figure 2.

Calibration curve for ice thickness estimation. The hole intensity (mean gray value measured within a hole at low magnification, ) is correlated with the hole ice thickness, calculated from tilted pairs acquired at high magnification (). This conversion curve was used to draw all thickness distributions reported in Figs. 4 and 5.
Single-particle cryo-EM analysis of m5-HT3A receptor in A8-35
The m5-HT3AR was expressed and purified as previously described (30). Following a standard detergent-APol exchange protocol (34), the m5-HT3AR was transferred from C12E9 to A8-35 as performed in ref. (35). The m5-HT3AR/A8-35 complexes were then purified by size exclusion chromatography to remove APol excess that is unbound to m5-HT3AR. Concentrated A8-35 solutions were then added to samples at 2 g/L of m5-HT3AR to reach desired polymer concentrations. 3.0 μL of sample were deposited on glow-discharged R1.2/1.3 Cu/Rh 300 Quantifoil grids (Quantifoil, Germany), before blot-plunge-freezing with a Vitrobot Mark IV (Thermo Fisher Scientific, USA). Grids were observed on a Glacios electron microscope (Thermo Fisher Scientific, USA) equipped with a Gatan K2 summit camera (Gatan Ametek, USA). Details about data collection are provided in Table S1.
Results
Physico-chemical properties of APol- versus DDM-containing solutions
To analyze the impact of surfactants on cryo-EM film preparation, we investigated the behavior of solutions containing either APol A8-35 or DDM as a function of surfactant concentration. We first performed liquid spreading experiments on non-plasma-activated carbon surfaces. The liquid spreading kinetics were slow enough to allow the measurement of contact angle variations of both A8-35 and DDM solutions (Fig. S2). However, when the carbon surfaces were made hydrophilic by a glow-discharge treatment, the drop spreading was very fast. This prevents the measurement of contact angle at any surfactant concentration (data not shown) and ensures that surface wetting dynamics is not a limitation for the cryo-film formation. We then measured the stability of centimetric liquid films and the dynamic surface tension of surfactant solutions (Fig. 3).
Figure 3.

Properties of solutions containing increasing concentrations of surfactants. Characterization of solutions containing APol A8-35 (a and b) and DDM (c and d). (a) and (c) show evolution of liquid film stability measured with the film pulling method for APol and detergent solutions, respectively (centimetric films, 100% humidity, error bars are standard deviations calculated with 300 measures per data point). Note that films generated at 3 g/L A8-35 and above 0.5 mM DDM were too stable to allow measurements. (b) and (d) show short-time surface tension variation at the air-water interface for APol and detergent solutions, respectively. To see this figure in color, go online.
In the case of APol solutions, the stability of thin aqueous films and the kinetics of the air-water interface coverage showed a similar behavior (Fig. 3 a and b). Below a threshold concentration close to 0.1 g/L, the liquid film lifetime doubles over three concentration decades (Fig. 3 a), and no significant surface tension decrease is observed (Fig. 3 b). Above this concentration, the film lifetime doubles over concentrations varying by only one order of magnitude, and the air-water interface is partially covered within 0.1 s, as shown by the measurable drop of surface tension at short times. Considering the critical aggregation concentration (CAC) of A8-35 (36), this threshold concentration appears surprisingly high, 50 times above the CAC, which suggests that the observed variations in the properties of APol-containing solutions are not linked to the onset of aggregate formation.
In the case of detergent solutions, the onset of liquid film stability increase was found to occur at 0.1 mM, slightly below the CMC (0.17 mM) (22), in good correlation with the decrease of the surface tension at short times (Fig. 3 c).
During cryo-EM specimen preparation, the delay between the blot and the freezing step is short at around 500–1000 ms, which fixes the characteristic age of the interfaces. This suggests that short-time surface tension and the corresponding bulk concentration of surfactants could be important in ice film formation.
Variations of cryo-EM ice properties with surfactant concentrations
In order to compare the observations on A8-35-containing solutions with ice film properties in holey carbon grids, ice distribution and thickness were analyzed as a function of APol concentrations (Fig. 4).
Figure 4.

Impact of A8-35 concentration on ice distribution and thickness on cryo-EM grids. (a) Low-magnification (LM, 500) picture of a grid square (scale bar: 10 μm). The deposited sample was A8-35 at 0.003 g/L in Tris/NaCl buffer. Bright holes with sharp edges (highlighted by yellow circles) were empty, and those covered by thick ice patches (yellow stars) were categorized in the "ice patch" population. All remaining holes (except those recovered by ice crystal contaminations; red stars) were used for ice thickness estimation. (b) Proportion of each hole population in cryo-EM grid (error bars for each population are standard deviations calculated from proportions of holes on grids at each APol concentration). (c–h) Distributions of ice thickness with A8-35 concentrations ranging from 10−4 g/L to 3 g/L. The ice thickness measurements were performed using a calibration curve (see Fig. 2) plotting the ice thickness obtained with stereo pairs of high-magnification images of holes at known angles (+15°/–15°) and the intensity of the same hole at LM (for more details, see materials and methods). The calibration curve allowed us to estimate the ice thickness of a large number of holes based on intensity measurements performed on sets of LM pictures (30–40 images/grid, 11,000 ± 4000 holes/grid). For each concentration, three to four grids were analyzed, leading to as many distributions, normalized on the number of exploitable holes with ice films. To see this figure in color, go online.
LM images of 35 squares randomly chosen on each grid were systematically acquired (see atlases in Fig. S1). At a glance, the sets of LM images reflect the overall quality of the grids, which tend to be more homogeneous as APol concentration increases. Three different types of holes (empty holes/broken films; holes with ice films; holes recovered by thick ice patches resulting from ill-blotted liquid) were identified with LM images for each A8-35 concentration (Fig. 4 a). Although some liquid may flow through the holes on the back side, ice patches are more likely to be present on the side of the grid where the sample was deposited. However, there is no possibility to distinguish between the two sides of the grids, since the cryo-EM images result from electron transmission. The quantification of each type of hole reveals no significant differences for concentrations under 0.1 g/L, whereas the impact of A8-35 became significant at 0.3 g/L and above (Fig. 4 b), highlighting the same threshold concentration as observed in Fig. 3. The ice thickness was measured as explained in the materials and methods using the calibration curve given in Fig. 2. Like for hole populations with ice films, ice thickness distributions reveal a lack of control for A8-35 concentrations below 0.1 g/L, whereas the reproducibility is highly improved at 0.3 g/L and above (Fig. 4 c–h). The bimodal ice thickness distribution observed at 0.3 g/L A8-35, showing thin films (37 2 nm) and thicker films (ranging from 50 to 160 nm), refines to a single distribution (35 1 nm) when the concentration of A8-35 reaches 1 g/L. The disappearance of the thick mode may be attributed to the increase of the liquid thin film stability (Fig. 3), which makes the stabilization of thin cryo-films possible.
Similar experiments were conducted on DDM at two representative concentrations, below and above the CMC of 0.17 mM (Fig. 5). Grids prepared with DDM at 0.1 and 1 mM showed an important proportion of holes with ice films (54% and 80%, respectively) and a shift of the mean ice thickness (from 34 1 to 31 1 nm). Ice properties obtained with DDM exhibit thickness distributions to be narrow and close to the distributions of highly concentrated APol solutions.
Figure 5.

Variation of cryo-EM ice properties with DDM concentrations. (a) Proportion of each hole population in cryo-EM grid (error bars for each population are standard deviations calculated from proportions of holes on grids at each DDM concentration). (b and c) Distributions of ice thickness with DDM concentrations. The experimental procedure for ice thickness determination was as described in the legend for Fig. 4. To see this figure in color, go online.
Effect of APols on protein orientation for single-particle analysis
In order to assess if A8-35 can protect protein from adsorption at the air-water interface, the full-length mouse serotonin type 3 homomeric receptor (m5-HT3AR) was used as model MP. After purification in detergent, the m5-HT3AR was transferred in A8-35 following a standard detergent-APol exchange procedure (34) and further purified by size exclusion chromatography (see Fig. S3) in order to remove the excess of MP-unbound APol. Under this condition, a previous cryo-EM analysis showed a large proportion of top-view particles, combined with a suspected problem of a thick ice layer (35). This prevented the obtention of interpretable 3D reconstructions. Based on our findings on the physico-chemical study of APol-containing solutions, we attempted to better control the ice thickness while minimizing the issue of preferred orientation by supplementing an m5-HT3AR/A8-35 sample with A8-35, to reach final concentrations of 0.3 or 1 g/L.
The cryo-EM image of protein-free sample containing A8-35 at 1 g/L (control) showed no background resulting from the presence of APol aggregates (Fig. S4 a). Therefore, particles observed on the micrographs can be unambiguously attributed to the m5-HT3AR. After supplementing the sample of m5-HT3AR/A8-35 complexes with 1 g/L A8-35, particles with different orientations were observed but excluded from the hole center (Fig. S4 b). Although a 3D reconstruction might be possible from images where particles are grouped on the edges of the holes as shown in Fig. S4 b, this is not an ideal situation because, in practice, all the particles are close to each other and may overlap. This prevents good data treatment and decreases the number of exploitable particles per image. Optimizing the experimental conditions to obtain evenly distributed particles is to be preferred. The best results of protein distribution through the ice layer were obtained when working at 0.3 g/L of A8-35 (see Fig. S4). An improved distribution of well-dispersed particles with both top and side views was observed, leading to the data set exploited in Fig. 6. Looking at particle orientation, the addition of A8-35 led to a majority of tilted and side views (Fig. 6 b), in contrast with predominant top views from previous work with no APol excess (35). The variety of orientations allowed to obtain the first 3D-reconstruction map of the m5-HT3AR in A8-35, at a nominal resolution of 3.37 Å (Fig. 6 c). Despite the particle orientation not being fully randomized (Fig. 6 d), adding an A8-35 excess before sample vitrification significantly improved image quality, especially regarding preferred orientation issues, in good agreement with other studies (37). This highlights the importance of creating stable thin films, whose thickness is large enough to avoid the exclusion of the proteins from the film center and small enough to minimize noise. In the particular case of the m5-HT3AR, this optimization cannot be achieved with DDM. Even though stable films can be obtained at 1 mM, a concentration sufficient to prevent protein aggregation in aqueous solutions, previous work showed some m5-HT3AR aggregation in cryo-films at this DDM concentration (35).
Figure 6.

Cryo-EM data set of the homomeric mouse 5-HT3A receptor reconstituted in APol A8-35, supplemented with 0.3 g/L of A8-35. (a) Representative micrograph of the analyzed data set (scale bar: 100 nm). (b) Representative 2D class averages separated into two main groups: top views (upper panels) and tilted views (lower panels) with indicated counts for each group. (c) Unsharpened cryo-EM map (3D reconstruction) colored by estimated local resolution, where the scale indicates the corresponding values in Angstroms (accession EMDB code: EMD-15471). The extracellular domain (ECD) and transmembrane domain (TMD) are also indicated. (d) Projections of the particles over azimuth and elevation angles calculated for the 3D reconstruction depicted in (c). To see this figure in color, go online.
Discussion
Over the past decade, the single-particle cryo-EM technique has emerged as a powerful approach in the field of structural biology. However, obtaining high-resolution structures of MPs remains a major challenge, the main bottlenecks being the production of MP samples and finding optimal conditions to obtain high-quality cryo-EM specimens for imaging. The tendency of MPs to aggregate on the carbon surface, to concentrate on the edges of the holes, and/or to adsorb at the air-water interface are the most prevalent problems encountered during cryo-EM specimen preparation. To address these challenges, a variety of experimental approaches have been developed, both in terms of sample preparation and innovative ways of preparing the grids themselves. At the sample preparation stage, ionic strength, pH, and protein concentration are all parameters that can be optimized (18). Surfactant exchange is also frequently performed between MP purification and grid preparation (8), requiring extensive sample optimization each time the structural study of a new MP is undertaken. In order to understand the extent to which surfactants contribute to the cryo-specimen quality, we investigated the role of two different types of surfactants (DDM, a standard detergent, and A8-35, the APol of reference) on the stability and thickness of thin ice films. These two surfactants are traditionally used at very low concentrations in MP samples since, in the case of detergents, a concentration close to the CMC usually preserves protein stability, and in the case of APol A8-35, its strong association with the transmembrane domain of MPs allows us to work without any polymer excess in the samples. In our work, the ice characterization on cryo-EM grids was performed as a function of surfactant concentration. Here, protein-free surfactant solutions were used to examine the impact of surfactants alone, without interference from proteins, which can adsorb to the air-water interface and contribute to modify the interfacial properties of cryo-films (19,38).
All of our data obtained with APol-containing solutions showed that a decrease in the empty hole population on cryo-EM grids correlates both with an increase in the stability of centimetric liquid films and with surface tension dynamics. The threshold concentration of A8-35 at which the proportion of empty holes versus thin ice films reverses is found between 0.1 and 0.3 g/L (Fig. 4 b). The same threshold concentration is also observed in the stability of thin aqueous films and in the kinetics of the air-water interface coverage. In addition, the polymer concentration increase results in more reproducible ice thickness profiles (Fig. 4). This can be seen in detail in the thickness profile analysis of Figs. S5 and S6. For DDM, the onset of increased stability was found to occur from 0.1 mM, which is a concentration slightly below the CMC (0.17 mM), whereas in the case of A8-35, the onset of stability increase was found 50 times above the CAC.
The microscopic origin of the correlation between the physico-chemical behavior of surfactants and cryo-EM grid patterns could be due to several effects linked to 1) the wetting of the grid surface, 2) adsorption timescales of surfactants at the gas-liquid interface, and 3) quantity of surfactants in solution. These three mechanisms will now be discussed independently.
To investigate liquid spreading, we measured the wetting dynamics of carbon surfaces, made hydrophilic by a glow-discharge treatment. Even if macroscopic measurements might not fully describe the high complexity of liquid spreading, deposition of surfactant drops on carbon surfaces was studied to grasp a first general idea about liquid behavior during cryo-EM specimen preparation. Drop spreading was too fast to be measured at any surfactant concentration (data not shown), which means that grid wetting dynamics is never critical at the stage of the sample deposition. However, cryo-films do not simply result from the primary liquid spreading on the grid surface, and the situation may be different after grid blotting. The characteristics of the plasma-activated carbon surface could be affected by the contact with the filter paper and/or by surface adsorption of polymers, which could modify the carbon surface wettability, even if glow-discharge treatments should limit this modification (39). It should be noted that the wettability of the carbon surface in the absence of glow-discharge treatment strongly depends on A8-35 concentration, with, interestingly, a threshold concentration at 0.1 g/L (Fig. S2).
Let us now consider the role of the surfactants at the gas-liquid interfaces. It is very well known that when the timescale of surfactant adsorption at the surface of the aqueous film is too large compared with the film generation timescales, films are highly unstable and even difficult to create (40). The characteristic adsorption timescale can be estimated through diffusion if we know the surfactant concentrations in the bulk c and at the surface , the diffusion coefficient D, and the film thickness. In this calculation, there are two limits: a dilute limit, in which the adsorption timescale is fixed by the diffusion of the surfactant molecules through the entire film thickness, and a concentrated limit where there are sufficient surfactants in a layer close to the surface and diffusion must be calculated only through this characteristic length. To know in which limit we are, we need to compare the number of the surfactant molecules in the interface and in the bulk, which gives the Lucassen length .
We estimate the surface concentration close to the CAC for A8-35 (or CMC for DDM) from the equilibrium surface tension measurements () using the Gibbs equation. This gives a surface concentration of 1.7−10 g/m2 for A8-35 and 3.0−6 mol/m2 for DDM. This leads to values of , which are always larger than the maximal film thickness (no bigger than 200 nm) even for the highest tested concentrations of surfactants ( = 280 nm for a film at 10 g/L of A8-35, and = 390 nm for a film at 10 mM of DDM). This means that the diffusion timescale must be calculated through the entire film thickness. Knowing the diffusion coefficients, calculated to be 3.1.10−11 m2 s−1 for A8-35 and 1.2.10−10 m2 s−1 for DDM, this gives a diffusion timescale under 100 ms for all concentrations above the observed transitions (0.1 g/L for A8-35 and 0.1 mM for DDM), which is always below the 1-s characteristic time between blotting and freezing. Therefore, diffusion is not the limiting parameter.
We are left with the quantity of surfactant. Considering is always larger than , there is not enough surfactant in the cryo-films to reach a full-surface coverage of the interfaces, even if all of the surfactants are adsorbed at the gas-liquid interfaces. In reality this never happens, as the surfactants always distribute between the bulk and the interfaces. By calculating the maximum reachable values of , assuming all the surfactant is at the interfaces, the values can be compared with the maximal surface concentration around the CAC (or CMC), as shown by the dotted lines in Fig. 7. We observe that the increased cryo-film stability is obtained at very low maximal surface concentrations, only around a few percent of maximal coverage for both surfactants. This might seem very surprising; nevertheless, even low concentrations of surfactant can lead to small differences in surface tension, which in turn leads to an observable increase in film stability (41, 42). This can also be observed in Fig. 3, where short time changes in surface tension (Fig. 3 b and d) are correlated with increased film stability (Fig. 3 a and c). Nevertheless, it should be noted that the presence of MPs in samples for single-particle cryo-EM analysis may also impact the cryo-film formation. This could modify the minimal surfactant concentration to stabilize cryo-films but also the ice thickness values compared with those obtained with the corresponding surfactant-only solutions.
Figure 7.

Estimation of the effective surfactant coverage of the cryo-film interfaces, depending on the initial sample surfactant concentration. Those estimations were performed for APol A8-35 (a) and DDM (b) by modeling the films as cylinders with a diameter of 2 μm and a thickness of 0.04 μm. This allowed for a calculation of the total amount of surfactant within a film, leading to a surface concentration when assuming that all surfactants reach and adsorb to the air-water interface.
Increasing liquid film stability to form cryo-films is important but not the only criterion to assess grid quality. The ice thickness and protein distribution/orientation within the cryo-films are two other important criteria of quality. DDM, at the two concentrations tested (1.7-fold below and 5.9-fold above the CMC), generates ice films with the same thickness range. Knowing that DDM is generally not used below the CMC (in order to prevent protein aggregation), the ice thickness should be very thin. Problems of particle exclusion from the film center and/or film rupture after cryofixation may be the reasons for which a frequent detergent exchange is reported in the literature. To limit this drawback, detergents with a lower CMC value than that of DDM, such as lauryl maltoside-neopentyl glycol (10 M) (43) or glyco-diogenin (18 M) (44), or the use of nanodiscs or APols is thus favored. When APol A8-35 is used, we showed that the ice thickness covers a larger range, making it easier to finely tune this parameter with the polymer concentration. In contrast to detergents, A8-35 is generally not used in excess in MP samples. This study reveals that the absence of A8-35 in excess in MP/A8-35 samples may result in some cases in ice being too thick, as previously reported in the structural study of the full-length mouse serotonin type 3 homomeric receptor (m5-HT3AR) (35). Here, the addition of A8-35 in excess in the m5-HT3AR/A8-35 sample allows us to improve the ice quality. This is a good example of single-particle cryo-EM application of MP samples for which experimental conditions deduced from the physico-chemical study of surfactant-only solutions allow the optimization of the cryo-EM specimen preparation. This is a first proof of concept, which deserves to be applied and tested on other MP samples. Additional examples will tell whether this approach can be reliably predictive or not.
Protein adsorption at the air-water interface, leading to preferred particle orientations and/or protein denaturation, is another problem that affects both MPs and soluble proteins. This behavior is more or less pronounced depending on the target protein and leads to a loss of information for the 3D reconstruction. Different approaches have been developed to overcome this issue, such as adsorbing proteins on a graphene support (45), reducing the particle dwell time before vitrification (46), adding a macromolecular binding partner (47), or adding a high-CMC detergent in the sample (48). In the last case, protein adsorption is likely prevented through formation of a protective detergent layer at the air-water interface (19). This has also been evidenced with cryo-EM studies of soluble proteins, reporting that the addition of small amounts of surfactants, such as CHAPSO (48) or APols (26, 27), to a sample before vitrification can improve particle distribution and/or orientation within the ice film, facilitating the collection of various angle views required for 3D reconstitution. This improvement highlights the beneficial role of surfactants in cryo-EM grid optimization. Achieving a similar protection with A8-35 on MP adsorption, while keeping a control over film thickness, was shown with m5-HT3AR, used as model protein. The addition of A8-35 at a defined concentration into an m5-HT3AR/A8-35 sample before vitrification resulted in good particle distribution exhibiting many angular distributions, allowing the 3D reconstruction of m5-HT3AR in A8-35 at high resolution.
In conclusion, we have shown that the physico-chemical properties of surfactant solutions can be related to ice quality, opening ways of sample optimization for cryo-EM studies of challenging mammalian MPs. We show that the stability of the cryo-films is ensured by the presence of a minimal quantity of surfactant, corresponding to around 1% of the maximal surface coverage for both DDM and A8-35. This study also reveals that DDM at a concentration slightly below and above the CMC always generates thin cryo-films, whereas the ice thickness covers a larger range when A8-35 is used, making thickness control possible. This allowed us to improve the particle distribution and orientation in stable films with the presence of APol A8-35 in a sample of m5-HT3AR/A8-35 complexes, enabling a high-resolution 3D reconstitution. Although other critical parameters can affect the quality of the cryo-EM specimen, such as grids or blotting conditions, adding an excess of APol A8-35 in samples before vitrification is a simpler alternative compared with current experimental approaches that resort to the use of surfactant combinations to find favorable grid preparation conditions or high-CMC detergents, such as FosCholine, sometimes responsible for protein destabilization (49), or even megabodies, which may require important engineering work (47). The same approach could be applied with the new generation of APols (dubbed CyclAPols) (50, 51) that allow solubilization and purification of MPs to cryo-EM analysis without any detergent exchange (52).
Author contributions
M.Z. conceptualized the study and acquired funding from CNRS with A.S. B.M., A.L., E.R., A.S., and M.Z. designed the experiments. B.M. performed the physico-chemical measurements with E.R. and A.S. B.M. performed the cryo-EM analysis of surfactant solutions with A.L. and J.D. U.L.-S. produced the m5-HT3AR sample and performed the cryo-EM analysis with H.N. All authors wrote the manuscript and approved the final version.
Acknowledgments
We thank the Mmoi team for all scientific discussions and training in using experimental devices. We would also like to thank Christophe Tribet for leading the initial work on surface tension measurements with amphipols, which provided valuable data for the present study. This work was supported by the Centre National de la Recherche Scientifique (CNRS) with a specific 80PRIME grant, the Université Paris Cité, and the “Initiative d’Excellence'' program from the French State (Grant “DYNAMO”, ANR-11-LABX-0011-01). This work used the cryo-EM LPS platform with support from the French METSA network (FR3507) and Labex PALM (ANR-10LABX-0039-PALM), as well as the EM facilities at the Grenoble Instruct-ERIC Center (ISBG; UAR 3518 CNRS CEA-UGA-EMBL) with support from the French Infrastructure for Integrated Structural Biology (FRISBI; ANR-10-INSB-0005-02) and GRAL, a project of the University Grenoble Alpes graduate school (Ecoles Universitaires de Recherche) CBH-EUR-GS (ANR-17-EURE-0003) within the Grenoble Partnership for Structural Biology. The IBS Electron Microscope facility is supported by the Auvergne Rhône-Alpes Region, the Fonds Feder, the Fondation pour la Recherche Médicale, and GIS-IBiSA. We thank Guy Schoehn and Eleftherios Zarkadas for their help during data collection.
Declaration of interests
The authors declare no competing interests.
Editor: Bridget Carragher.
Footnotes
Supporting Material can be found online at https://doi.org/10.1016/j.bpj.2023.04.016.
Contributor Information
Amélie Leforestier, Email: amelie.leforestier@universite-paris-saclay.fr.
Manuela Zoonens, Email: manuela.zoonens@ibpc.fr.
Supporting material
References
- 1.Kühlbrandt W. The resolution revolution. Science. 2014;343:1443–1444. doi: 10.1126/science.1251652. [DOI] [PubMed] [Google Scholar]
- 2.Vinothkumar K.R., Henderson R. Single particle electron cryomicroscopy: trends, issues and future perspective. Q. Rev. Biophys. 2016;49:e13. doi: 10.1017/S0033583516000068. [DOI] [PubMed] [Google Scholar]
- 3.Nwanochie E., Uversky V.N. Structure determination by single-particle cryo-electron microscopy: only the sky (and intrinsic disorder) is the limit. Int. J. Mol. Sci. 2019;20:4186. doi: 10.3390/ijms20174186. [DOI] [PMC free article] [PubMed] [Google Scholar]
- 4.Liao M., Cao E., et al. Cheng Y. Structure of the TRPV1 ion channel determined by electron cryo-microscopy. Nature. 2013;504:107–112. doi: 10.1038/nature12822. [DOI] [PMC free article] [PubMed] [Google Scholar]
- 5.Popot J.-L., Althoff T., et al. Zoonens M. Amphipols from A to Z. Annu. Rev. Biophys. 2011;40:379–408. doi: 10.1146/annurev-biophys-042910-155219. [DOI] [PubMed] [Google Scholar]
- 6.Zoonens M., Popot J.-L. Amphipols for each season. J. Membr. Biol. 2014;247:759–796. doi: 10.1007/s00232-014-9666-8. [DOI] [PMC free article] [PubMed] [Google Scholar]
- 7.Popot J.-L. Springer International Publishing; 2018. Membrane Proteins in Aqueous Solutions: From Detergents to Amphipols. [Google Scholar]
- 8.Le Bon C., Michon B., et al. Zoonens M. Amphipathic environments for determining the structure of membrane proteins by single-particle electron cryo-microscopy. Q. Rev. Biophys. 2021;54:e6. doi: 10.1017/S0033583521000044. [DOI] [PubMed] [Google Scholar]
- 9.https://blanco.biomol.uci.edu/mpstruc/
- 10.Dubochet J., Lepault J., et al. Homo J.-C. Electron microscopy of frozen water and aqueous solutions. J. Microsc. 1982;128:219–237. [Google Scholar]
- 11.Dubochet J., Adrian M., et al. Schultz P. Cryo-electron microscopy of vitrified specimens. Q. Rev. Biophys. 1988;21:129–228. doi: 10.1017/s0033583500004297. [DOI] [PubMed] [Google Scholar]
- 12.Feng X., Fu Z., et al. Lin Q. A fast and effective microfluidic spraying-plunging method for high-resolution single-particle cryo-EM. Structure. 2017;25:663–670.e3. doi: 10.1016/j.str.2017.02.005. [DOI] [PMC free article] [PubMed] [Google Scholar]
- 13.Arnold S.A., Albiez S., et al. Braun T. Blotting-free and lossless cryo-electron microscopy grid preparation from nanoliter-sized protein samples and single-cell extracts. J. Struct. Biol. 2017;197:220–226. doi: 10.1016/j.jsb.2016.11.002. [DOI] [PubMed] [Google Scholar]
- 14.Schmidli C., Albiez S., et al. Braun T. Microfluidic protein isolation and sample preparation for high-resolution cryo-EM. Proc. Natl. Acad. Sci. USA. 2019;116:15007–15012. doi: 10.1073/pnas.1907214116. [DOI] [PMC free article] [PubMed] [Google Scholar]
- 15.Ravelli R.B.G., Nijpels F.J.T., et al. Peters P.J. Cryo-EM structures from sub-nl volumes using pin-printing and jet vitrification. Nat. Commun. 2020;11:2563. doi: 10.1038/s41467-020-16392-5. [DOI] [PMC free article] [PubMed] [Google Scholar]
- 16.Drulyte I., Johnson R.M., et al. Thompson R.F. Approaches to altering particle distributions in cryo-electron microscopy sample preparation. Acta Crystallogr. D Struct. Biol. 2018;74:560–571. doi: 10.1107/S2059798318006496. [DOI] [PMC free article] [PubMed] [Google Scholar]
- 17.Carragher B., Cheng Y., et al. Wang H.-W. Current outcomes when optimizing ‘standard’ sample preparation for single-particle cryo-EM. J. Microsc. 2019;276:39–45. doi: 10.1111/jmi.12834. [DOI] [PMC free article] [PubMed] [Google Scholar]
- 18.Kampjut D., Steiner J., Sazanov L.A. Cryo-EM grid optimization for membrane proteins. iScience. 2021;24:102139. doi: 10.1016/j.isci.2021.102139. [DOI] [PMC free article] [PubMed] [Google Scholar]
- 19.Glaeser R.M., Han B.-G. Opinion: hazards faced by macromolecules when confined to thin aqueous films. Biophys. Rep. 2017;3:1–7. doi: 10.1007/s41048-016-0026-3. [DOI] [PMC free article] [PubMed] [Google Scholar]
- 20.Armstrong M., Han B.-G., et al. Glaeser R.M. Microscale fluid behavior during cryo-EM sample blotting. Biophys. J. 2020;118:708–719. doi: 10.1016/j.bpj.2019.12.017. [DOI] [PMC free article] [PubMed] [Google Scholar]
- 21.Saulnier L., Champougny L., et al. Rio E. A study of generation and rupture of soap films. Soft Matter. 2014;10:2899–2906. doi: 10.1039/c3sm52433g. [DOI] [PubMed] [Google Scholar]
- 22.Rosevear P., VanAken T., et al. Ferguson-Miller S. Alkyl glycoside detergents: a simpler synthesis and their effects on kinetic and physical properties of cytochrome c oxidase. Biochemistry. 1980;19:4108–4115. doi: 10.1021/bi00558a032. [DOI] [PubMed] [Google Scholar]
- 23.Tribet C., Audebert R., Popot J.-L. Amphipols: polymers that keep membrane proteins soluble in aqueous solutions. Proc. Natl. Acad. Sci. USA. 1996;93:15047–15050. doi: 10.1073/pnas.93.26.15047. [DOI] [PMC free article] [PubMed] [Google Scholar]
- 24.Flötenmeyer M., Weiss H., et al. Leonard K. The use of amphipathic polymers for cryo electron microscopy of NADH:ubiquinone oxidoreductase (complex I) J. Microsc. 2007;227:229–235. doi: 10.1111/j.1365-2818.2007.01805.x. [DOI] [PubMed] [Google Scholar]
- 25.Baker M.R., Fan G., Serysheva I.I. Single-particle cryo-EM of the ryanodine receptor channel in an aqueous environment. Eur. J. Transl. Myol. 2015;25:35–48. doi: 10.4081/ejtm.2015.4803. [DOI] [PMC free article] [PubMed] [Google Scholar]
- 26.Chowdhury S., Ketcham S.A., et al. Lander G.C. Structural organization of the dynein-dynactin complex bound to microtubules. Nat. Struct. Mol. Biol. 2015;22:345–347. doi: 10.1038/nsmb.2996. [DOI] [PMC free article] [PubMed] [Google Scholar]
- 27.Zhang C., Konermann S., et al. Lyumkis D. Structural basis for the RNA-guided ribonuclease activity of CRISPR-Cas13d. Cell. 2018;175:212–223.e17. doi: 10.1016/j.cell.2018.09.001. [DOI] [PMC free article] [PubMed] [Google Scholar]
- 28.Koehl A., Hu H., et al. Kobilka B.K. Structural insights into the activation of metabotropic glutamate receptors. Nature. 2019;566:79–84. doi: 10.1038/s41586-019-0881-4. [DOI] [PMC free article] [PubMed] [Google Scholar]
- 29.Fakhfouri G., Rahimian R., et al. Beaulieu J.-M. 5-HT3 receptor antagonists in neurologic and neuropsychiatric disorders: the iceberg still lies beneath the surface. Pharmacol. Rev. 2019;71:383–412. doi: 10.1124/pr.118.015487. [DOI] [PubMed] [Google Scholar]
- 30.Polovinkin L., Hassaine G., et al. Nury H. Conformational transitions of the serotonin 5-HT3 receptor. Nature. 2018;563:275–279. doi: 10.1038/s41586-018-0672-3. [DOI] [PMC free article] [PubMed] [Google Scholar]
- 31.Boulogne F. Cheap and versatile humidity regulator for environmentally controlled experiments. Eur. Phys. J. E Soft Matter. 2019;42:51. doi: 10.1140/epje/i2019-11813-0. [DOI] [PubMed] [Google Scholar]
- 32.Brown C.J., Trieber C., Overduin M. Structural biology of endogenous membrane protein assemblies in native nanodiscs. Curr. Opin. Struct. Biol. 2021;69:70–77. doi: 10.1016/j.sbi.2021.03.008. [DOI] [PubMed] [Google Scholar]
- 33.Rice W.J., Cheng A., et al. Potter C.S. Routine determination of ice thickness for cryo-EM grids. J. Struct. Biol. 2018;204:38–44. doi: 10.1016/j.jsb.2018.06.007. [DOI] [PMC free article] [PubMed] [Google Scholar]
- 34.Le Bon C., Marconnet A., et al. Zoonens M. Folding and stabilizing membrane proteins in amphipol A8-35. Methods. 2018;147:95–105. doi: 10.1016/j.ymeth.2018.04.012. [DOI] [PubMed] [Google Scholar]
- 35.Polovinkin L. Université Grenoble Alpes; 2019. Etudes structurales du récepteur 5-HT3. PhD thesis. [Google Scholar]
- 36.Giusti F., Popot J.-L., Tribet C. Well-defined critical association concentration and rapid adsorption at the air/water interface of a short amphiphilic polymer, amphipol A8-35: a study by Förster resonance energy transfer and dynamic surface tension measurements. Langmuir. 2012;28:10372–10380. doi: 10.1021/la300774d. [DOI] [PubMed] [Google Scholar]
- 37.Owji A.P., Zhao Q., et al. Yang T. Structural and functional characterization of the bestrophin-2 anion channel. Nat. Struct. Mol. Biol. 2020;27:382–391. doi: 10.1038/s41594-020-0402-z. [DOI] [PMC free article] [PubMed] [Google Scholar]
- 38.Glaeser R.M. Proteins, interfaces, and cryo-EM grids. Curr. Opin. Colloid Interface Sci. 2018;34:1–8. doi: 10.1016/j.cocis.2017.12.009. [DOI] [PMC free article] [PubMed] [Google Scholar]
- 39.Chen X., Farber M., et al. Hurt R.H. Mechanisms of surfactant adsorption on non-polar, air-oxidized and ozone-treated carbon surfaces. Carbon. 2003;41:1489–1500. [Google Scholar]
- 40.Saulnier L., Boos J., et al. Rio E. Comparison between generations of foams and single vertical films--single and mixed surfactant systems. Soft Matter. 2014;10:5280–5288. doi: 10.1039/c4sm00326h. [DOI] [PubMed] [Google Scholar]
- 41.Champougny L., Scheid B., et al. Rio E. Surfactant-induced rigidity of interfaces: a unified approach to free and dip-coated films. Soft Matter. 2015;11:2758–2770. doi: 10.1039/c4sm02661f. [DOI] [PubMed] [Google Scholar]
- 42.Chan D.Y.C., Klaseboer E., Manica R. Dynamic interactions between deformable drops in the Hele–Shaw geometry. Soft Matter. 2010;6:1809–1815. [Google Scholar]
- 43.Chae P.S., Rasmussen S.G.F., et al. Gellman S.H. Maltose-neopentyl glycol (MNG) amphiphiles for solubilization, stabilization and crystallization of membrane proteins. Nat. Methods. 2010;7:1003–1008. doi: 10.1038/nmeth.1526. [DOI] [PMC free article] [PubMed] [Google Scholar]
- 44.Chae P.S., Rasmussen S.G.F., et al. Gellman S.H. A new class of amphiphiles bearing rigid hydrophobic groups for solubilization and stabilization of membrane proteins. Chemistry. 2012;18:9485–9490. doi: 10.1002/chem.201200069. [DOI] [PMC free article] [PubMed] [Google Scholar]
- 45.D’Imprima E., Floris D., et al. Kühlbrandt W. Protein denaturation at the air-water interface and how to prevent it. Elife. 2019;8:e42747. doi: 10.7554/eLife.42747. [DOI] [PMC free article] [PubMed] [Google Scholar]
- 46.Noble A.J., Wei H., et al. Carragher B. Reducing effects of particle adsorption to the air-water interface in cryo-EM. Nat. Methods. 2018;15:793–795. doi: 10.1038/s41592-018-0139-3. [DOI] [PMC free article] [PubMed] [Google Scholar]
- 47.Uchański T., Masiulis S., et al. Steyaert J. Megabodies expand the nanobody toolkit for protein structure determination by single-particle cryo-EM. Nat. Methods. 2021;18:60–68. doi: 10.1038/s41592-020-01001-6. [DOI] [PMC free article] [PubMed] [Google Scholar]
- 48.Chen J., Noble A.J., et al. Darst S.A. Eliminating effects of particle adsorption to the air/water interface in single-particle cryo-electron microscopy: bacterial RNA polymerase and CHAPSO. J. Struct. Biol. X. 2019;1:100005. doi: 10.1016/j.yjsbx.2019.100005. [DOI] [PMC free article] [PubMed] [Google Scholar]
- 49.Zoonens M., Comer J., et al. Dehez F. Dangerous liaisons between detergents and membrane proteins. The case of mitochondrial uncoupling protein 2. J. Am. Chem. Soc. 2013;135:15174–15182. doi: 10.1021/ja407424v. [DOI] [PubMed] [Google Scholar]
- 50.Marconnet A., Michon B., et al. Zoonens M. Solubilization and stabilization of membrane proteins by Cycloalkane-modified amphiphilic polymers. Biomacromolecules. 2020;21:3459–3467. doi: 10.1021/acs.biomac.0c00929. [DOI] [PubMed] [Google Scholar]
- 51.Marconnet A., Michon B., et al. Zoonens M. Influence of hydrophobic groups attached to amphipathic polymers on the solubilization of membrane proteins along with their lipids. Anal. Chem. 2022;94:14151–14158. doi: 10.1021/acs.analchem.2c01746. [DOI] [PubMed] [Google Scholar]
- 52.Higgins A.J., Flynn A.J., et al. Muench S.P. Cycloalkane-modified amphiphilic polymers provide direct extraction of membrane proteins for CryoEM analysis. Commun. Biol. 2021;4:1337. doi: 10.1038/s42003-021-02834-3. [DOI] [PMC free article] [PubMed] [Google Scholar]
Associated Data
This section collects any data citations, data availability statements, or supplementary materials included in this article.