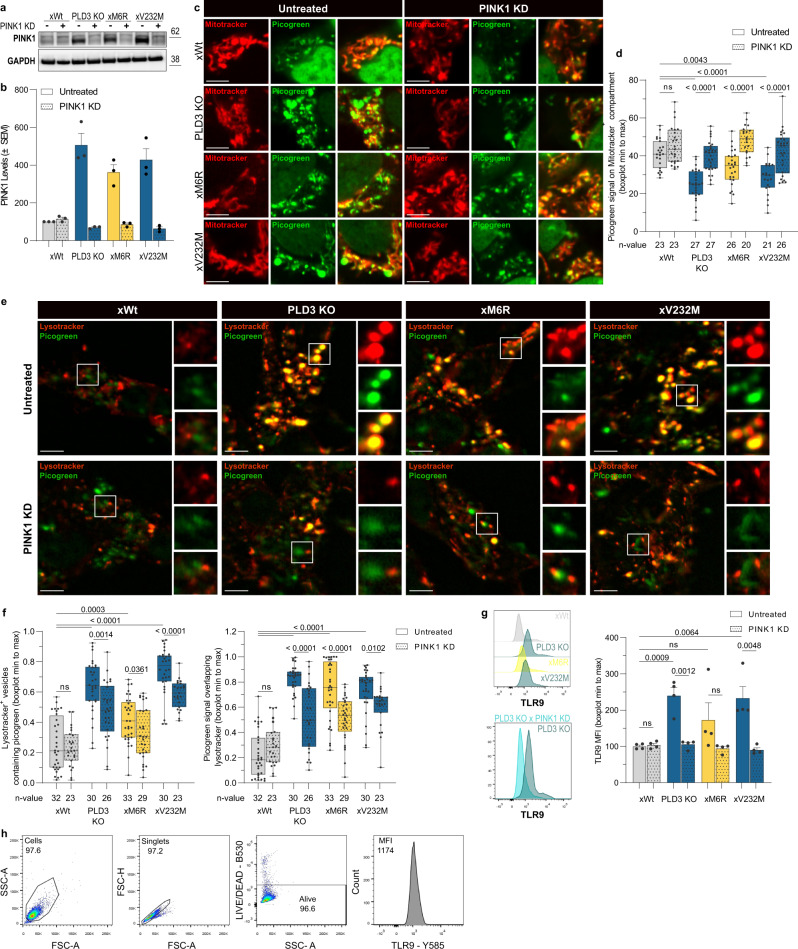
Fig. 3. PINK1-linked mitophagy delivers PLD3 substrates to lysosomes that cause a DNA build-up upon PLD3 dysfunction.
a Protein levels of PINK1, quantified in (b). PINK1 knockdown (KD) reduced PINK1 levels to baseline 24 h after transfection (n = 3; mean values ± SEM). c Representative images of mitotracker (mitochondria, red) — picogreen (ds/mtDNA, green) co-localizations. d Min to max boxplots (median as the center, the box extends from the 25th to 75th percentiles, and whiskers range from the smallest to the greatest value) depict the fraction of picogreen overlapping with mitotracker signal (n = 20–27). e Representative images of lysotracker (acidic compartment, red) — picogreen (ds/mtDNA, green) co-localizations. Scale bar = 5 µm in all cases. f Min to max boxplots show the quantification of the fraction of overlap between the lysotracker and picogreen signal, using Manders’ coefficients (n = 23–33). g Intracellular flow cytometry of TLR9 levels. The stopping gate was set at 10,000 events (n = 4). All statistical differences were calculated using unpaired t-tests as indicated. h Gating strategy of panel g. Source data are provided as a Source Data file.

