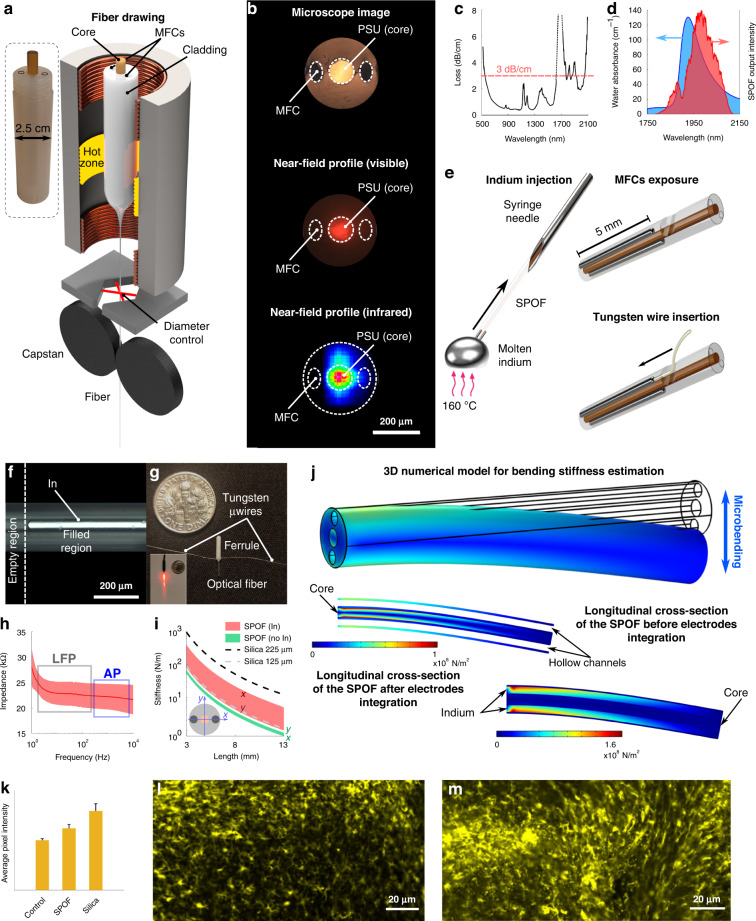
Fig. 1. Fabrication and characterization of the IR multifunctional neural interfaces.
a Schematic of the drawing process for the polymer optical fibre used to develop of the neural interfaces. In the inset, a picture of the preform used for the drawing, with the hollow channels on the sides of the preform highlighted by black ellipses. b From top to bottom: microscope image of the structure of the fabricated optical fibre and near-field profiles of the output light at both visible and IR wavelengths. c Attenuation spectrum of the SPOF in the spectral range spanning from 500 to 2100 nm wavelengths. The shaded regions show the spectral ranges with losses < 3 dB/cm. d Overlap between the absorbance of water (extracted from ref. 58) and the spectrum transmitted from the SPOF. The same light source and optical setup were used in the INS experiments shown later in the article. e Schematics of the fabrication steps to integrate electrodes in the optical fibre and connectorize them for EE recording. f Microscope image of the interface between the indium-filled and the hollow part of a microfluidic channel exposed for connectorization. g Assembled multifunctional probe after connectorization. Inset: visible light transmitted through the connectorized probe. h Impedance spectrum and corresponding standard deviation (shaded) of the integrated electrodes in the frequency ranges of LFPs and APs. i Simulation of the bending stiffness of the SPOF, both with and without microfluidic channels filled with indium and compared with the most commonly used silica optical fibres in neuroscience. j 3D numerical model of the distribution of von Mises stress in the SPOF during bending (top), showing the maximum concentration of stress shifting from the core (center) to the side channels (bottom) due to the injection of indium. k Average fluorescence intensity of the IBA 1 marker in 350 × 142 µm ROIs along the implantation region of SPOF-based interfaces and 225 µm silica fibres, compared with control animals (N slices > 7, 4 weeks implantation). l, m Representative images of IBA 1 marked microglia recruited at the implantation site of the SPOF interfaces and silica fibres, respectively

