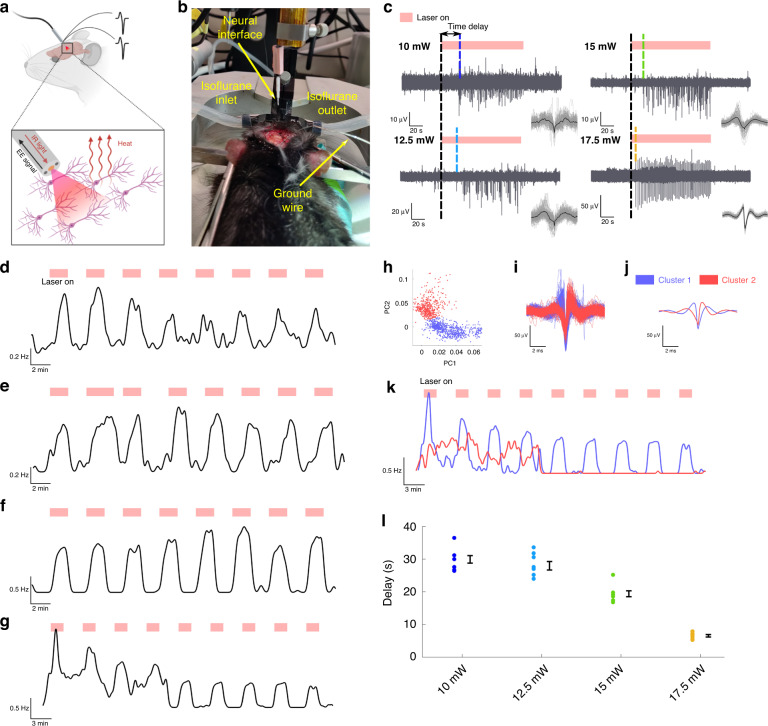
Fig. 2. Opto-electrophysiological interrogation of the brain.
a Concept of the experiment: delivering IR light with the developed interface to generate heat-induced variations in neural activity while conducting simultaneous electrophysiology based on the integrated electrodes. b Picture of the surgery for the insertion of the implant in the brain, taken immediately prior to the insertion. c Neural response to two minutes stimulation cycles for laser powers ranging from 10 to 17.5 mW; the dashed lines indicate the time delay between the beginning of the stimulation and the onset of the neural activity; the overlap of the recorded spikes (grey) and their average (black) shown as insets are also reported, with the respective scale bars, in Fig. S8. d–g Average firing rates over several stimulation cycles, calculated by convoluting the spikes temporal positions extracted by the signal in Fig. S6 with a Gaussian kernel, for stimulation powers of (d) 10 mW, (e) 12.5 mW, (f) 15 mW, and (g) 17.5 mW. h Gaussian mixture model clustering of the two first principal components for the spikes recorded over several stimulation cycles at a power of 17.5 mW. i, j Overlap and average shape, respectively, of the all the spikes recorded at 17.5 mW after clustering. k Average firing rates, calculated by convoluting the spikes’ temporal position with a Gaussian kernel, of the two units individuated by principal component analysis. l Delays between the beginning of the stimulation and the beginning of the recording activity for all stimulation cycles at different powers. The average and standard error are presented on the side of each series

