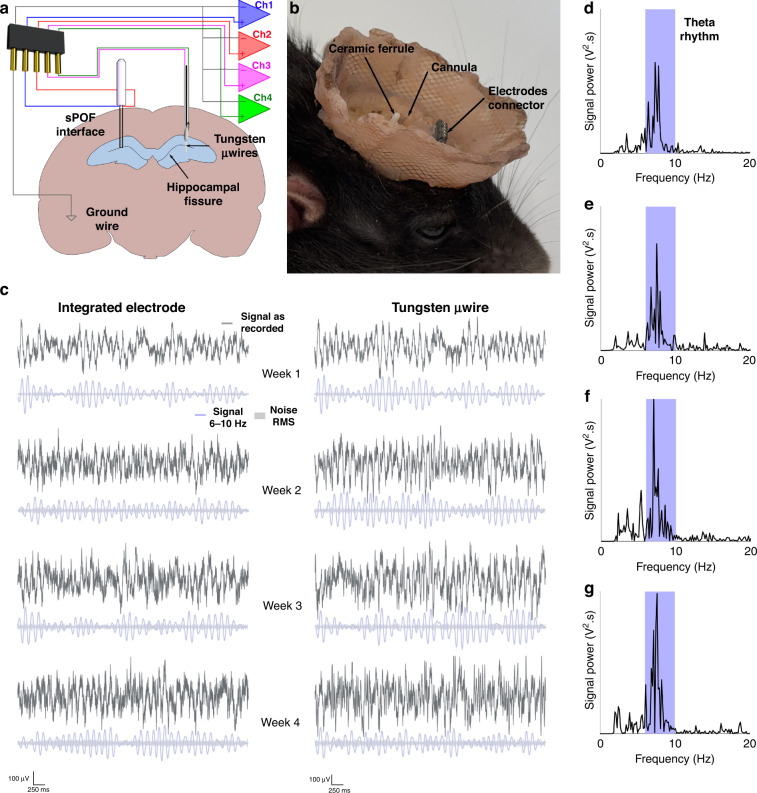
Fig. 4. Chronic local field potential measurement in the hippocampus.
a Schematic representation of the implants and recording setup. b Chronic implant of a multifunctional neural interface and a steel cannula with tungsten µwires in the brain. c Dark grey: 5-second-long EE recordings of LFPs in the hippocampus from an integrated indium electrode and a tungsten µwire over four weeks. Light blue: 6–10 Hz (Theta rhythm) component of the recorded signal. Light grey shading: root mean square amplitude of noise (defined here as recorded signal outside the 6–10 Hz range). d–g Power spectra of the indium electrode recordings shown in Fig. 4c for weeks 1, 2, 3 and 4 respectively, with the 6–10 Hz region corresponding to theta rhythm highlighted in light blue

