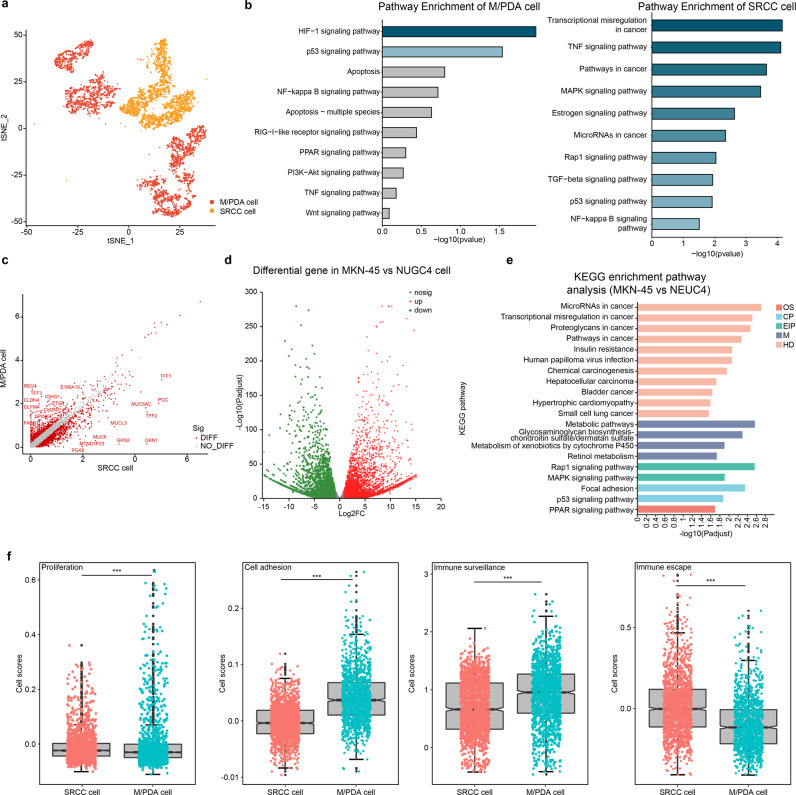
Fig. 5. Similarities and differences between M/PDA and SRCC cells.
a t-SNE plot of M/PDA and SRCC cells (coloured by cell type). b Pathway enrichment analysis plots of DEGs upregulated in M/PDA and SRCC cells. Compared with M/PDA cells, the DEGs upregulated in SRCC cells were mainly enriched in abnormally activated cancer-related signalling pathways (e.g., transcriptional misregulation in cancer, pathways in cancer and microRNAs in cancer) and were closely associated with signalling pathways of immune escape (e.g., TNF signalling pathway, TGF-β signalling pathway and NF-kB signalling pathway). c Heatmap plot of DEGs in M/PDA and SRCC cells. d Heatmap plot of DEGs in MKN-45 and NUGC4 cells. e KEGG pathway enrichment analysis of MKN-45 and NUGC4 cells among DEGs. f Differences between M/PDA and SRCC cells in terms of cell proliferation, cell adhesion, immune surveillance, and immune escape. M/PDA cells had high proliferation and immune surveillance capabilities, while SRCC cells had low cell adhesion and high immune escape capabilities (t-test, p < 0.001). n = 10 (include 3 samples in MDA and PDA groups, respectively; and 4 samples in GSRC group). Data are presented as mean values ± SEM. In the box plot, the black dots represent outliers, the error bars represent SEM, the box midpoints represent means and the boxes represent inter-quartile positions. p values were calculated using the two-sided unpaired Student’s t-test, p values < 0.05 were considered to indicate significance: ***p < 0.001. Source data are provided as a Source Data file.

