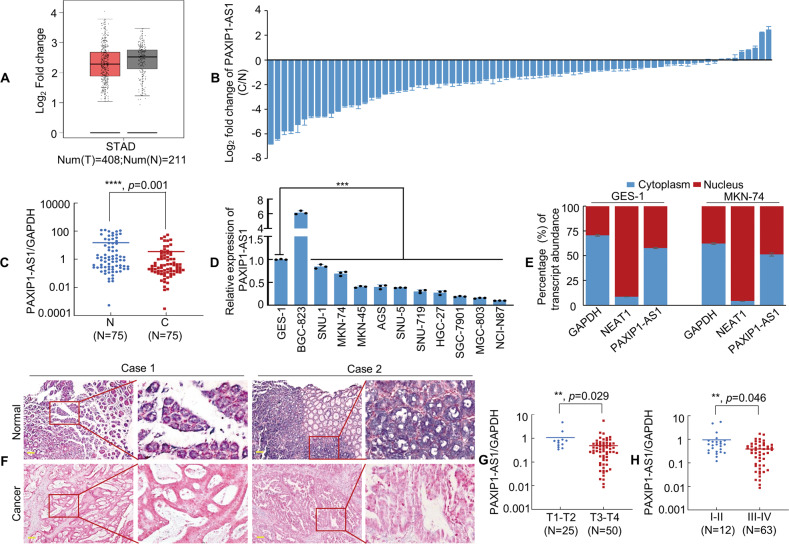
Fig. 2. PAXIP1-AS1 expression is downregulated in GC cell lines and tissues.
A The expression level of PAXIP1-AS1 in gastric tissue was determined from the GEPIA database, using the TCGA tumour matching TCGA and GTEx normal data. B, C PAXIP1-AS1 expression was detected by qPCR in 75 pairs of human GC and adjacent normal mucosal tissues. Error bars represent the standard deviation (SD) in three independent experiments. ****P < 0.001. N, Normal; C, Cancer. D The expression level of PAXIP1-AS1 in immortalised gastric mucosal cell line GES-1 and GC cell lines was obtained using qPCR. One-way analysis of variance (ANOVA) and Dunnett’s T3 multiple comparison test were used to compare the expression difference among GES-1 and all GC cell lines. ***P < 0.01. E Subcellular localisation of PAXIP1-AS1, GAPDH, and NEAT1 in GES-1 and MKN-74 cells. GAPDH mRNA and NEAT1 mRNA were used as controls for the cytoplasmic and nuclear fractions, respectively. F Representative In situ hybridization (ISH) images of PAXIP1-AS1 expression in normal gastric mucosa and GC tissues. Scale bar, 100 μm. G PAXIP1-AS1 expression level was lower in T3–4 than in T1–2 GC samples. **P < 0.05. H Expression of PAXIP1-AS1 in different clinical GC stages. **P < 0.05. stages I–II vs. stages III–IV.

