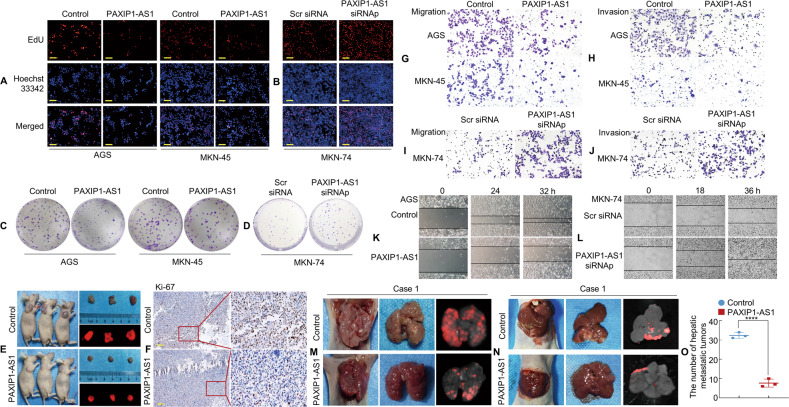
Fig. 3. Forced expression of PAXIP1-AS1 inhibits GC cell proliferation and metastasis.
A, B Representative micrographs of EdU positivity in cells transfected with Control and PAXIP1-AS1 (A) or Scr siRNA and PAXIP1-AS1 siRNAp (B). Red fluorescence represents EdU-positive cells and blue fluorescence from the Hoechst 33342 stain represents total cells. C, D Representative images of crystal violet stained cell colonies formed by the indicated GC cell, 14 d after inoculation. E Gross appearance and external whole-body fluorescence images of subcutaneous tumours from mice administered subcutaneous injection of MKN-74/RFP-Control and MKN-74/RFP-PAXIP1-AS1 cells. F The cell proliferation rate of PAXIP1-AS1 overexpressing tumours was significantly lower than that of Control, as observed by immunohistochemistry (IHC) assay with Ki-67. G–J Migration (G and I) and invasion (H and J) assays were conducted using GC cells transfected with PAXIP1-AS1 and Control (G and H) or PAXIP1-AS1 siRNAp and Scr siRNA (I and J). K, L The wound healing assay was used to detect GC cell motility following transfection with PAXIP1-AS1 and Control (K) or PAXIP1-AS1 siRNAp and Scr siRNA (L). M Lung samples were obtained from mice that received intravenous tail injections of MKN-74/PAXIP1-AS1 and Control cells, respectively (n = 3). N Representative images of livers from intrasplenic liver metastasis model constructed with MKN-74/PAXIP1-AS1 and control cells (n = 3). O The number of hepatic metastatic tumours of the control and PAXIP1-AS1 groups. Scale bars, 50 μm in A & B and 100 μm in F. For quantification, see Supplementary Figs. 3 & 4.

