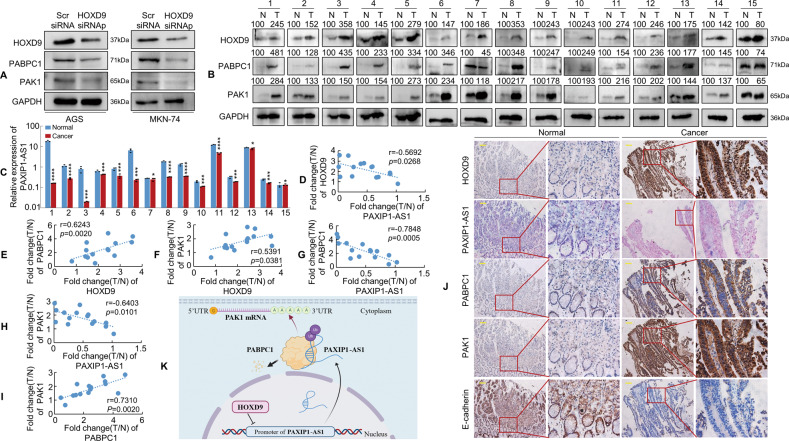
Fig. 8. PAXIP1-AS1 expression correlates inversely with HOXD9, PABPC1, and PAK1 expression in GC tissues.
A Scr siRNA and HOXD9 siRNAs were transfected into GC cells. The expression of HOXD9, PABPC1 and PAK1 was detected in GC cells using western blotting analysis. B, C Expression levels of HOXD9, PABPC1, PAK1, and PAXIP1-AS1 in 15 paired normal and GC tissue specimens were detected by western blotting (B) or qPCR (C) and normalised to GAPDH. N, normal; T, cancer. Student’s t-test; *P > 0.05; ***P < 0.01 and ****P < 0.001, normal vs. cancer. D–I Pearson correlation analysis was used to identify expression correlations between HOXD9 and PAXIP1-AS1 (D), HOXD9 and PABPC1 (E), HOXD9 and PAK1 (F), PAXIP1-AS1 and PABPC1 (G), PAXIP1-AS1 and PAK1 (H), and PABPC1 and PAK1 (I) using the expression data above. J The expression of indicated genes in normal and GC tissues was evaluated using IHC and ISH. Scale bar, 100 μm. K The hypothetical model depicts the roles of HOXD9, PAXIP1-AS1, PABPC1, and PAK1 in GC cells.

