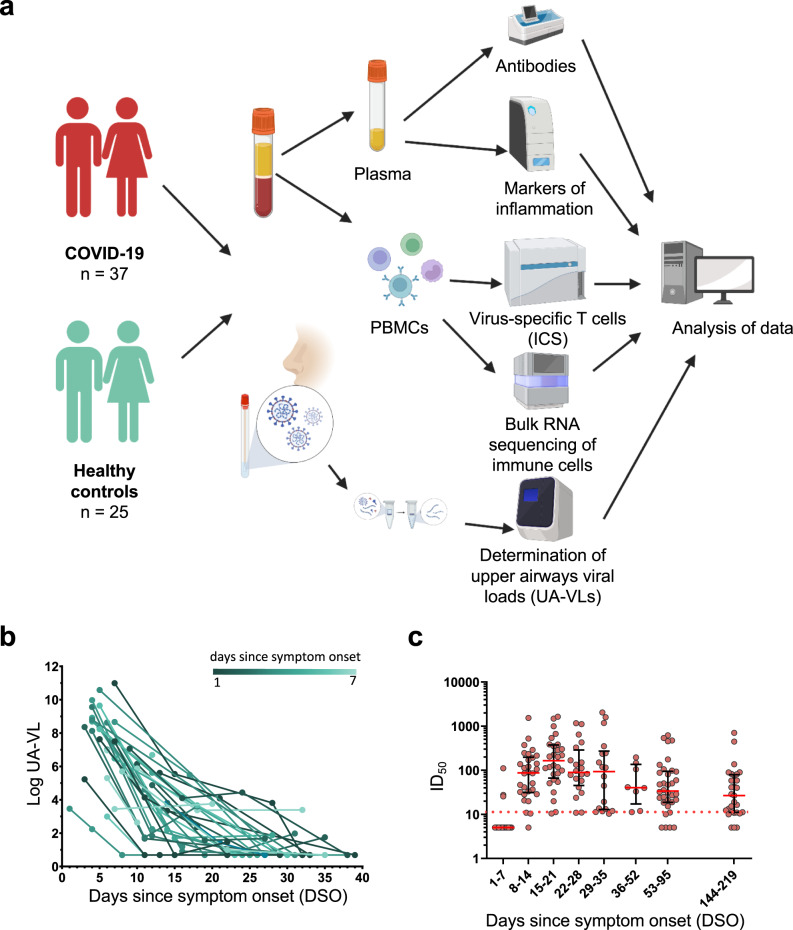
Fig. 1. Study overview, upper airways viral loads, and antibody-mediated neutralization of SARS-CoV-2.
a Schematic representation of the study design. Donors were sampled weekly for 1 month and then periodically until 6 months after initial presentation. b Longitudinal quantification of upper airways viral loads (UA-VLs) in patients with mild COVID-19 (n = 25) recruited during the first week after symptom onset. Each line represents one donor. The green scale stratifies patients according to days since symptom onset at presentation. c Pseudovirus neutralization titers (ID50) plotted versus days since symptom onset (DSO). Each dot represents one donor at one time point as follows: 0–7 DSO, n = 25; 8–14 DSO, n = 30; 15–21 DSO, n = 28; 22–28 DSO, n = 20; 29–35 DSO, n = 18; 36–52 DSO, n = 8; 53–95 DSO, n = 34; 144–219 DSO, n = 29. The cutoff is indicated by the dotted red line. Serum samples that did not achieve 50% neutralization (ID50 < 10) were assigned a value halfway below the lower limit of quantification (ID50 = 5). Data are shown as median ± IQR. Source data are provided as a source data file. Figure 1a was created with Biorender (publication licence number GL254AMU2N).

