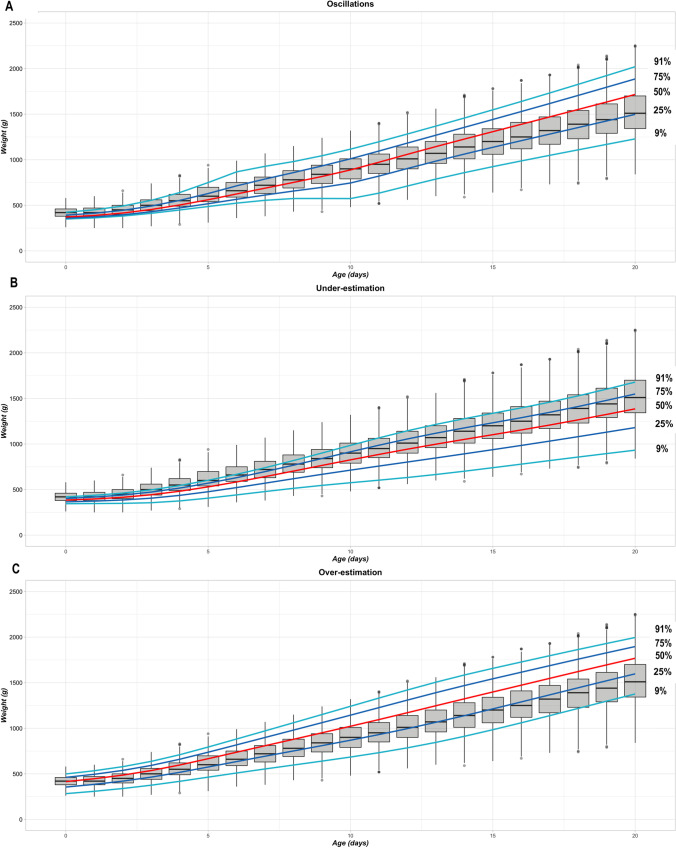
Fig. 4.
Patterns of breed-scale GCs simulated with sample sizes of three puppies. Each chart shows a different pattern of breed-scale growth centile curves for one of the 100 simulations for a sample size of three puppies from the Labrador Retriever training dataset: (A): oscillating pattern of growth; (B) underestimation of growth; (C) overestimation of growth. The centile curves overlay a box and whisker plot of the distribution of observed data per timepoint for the Labrador Retriever complete dataset (860 puppies). Boxes outline the interquartile range, the horizontal bars are the medians, the top and bottom whiskers extend to largest and smallest weight measures, respectively, within 1.5 times the interquartile range, and filled circles represent data points outside these ranges. BW, bodyweight; GCs, growth curves

