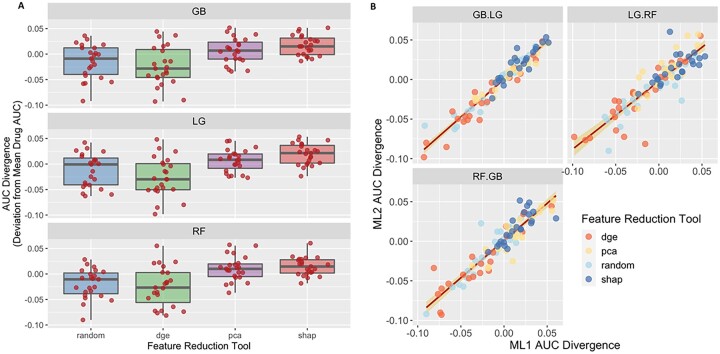
Fig. 4.
Evaluation of model performance. (A) Box-whisker plots for XGBoost (GB, top panel), LightGBM (LG, middle panel) and random forest (RF, bottom panel) were generated per each feature selection technique (PCA blue, DGE green, SHAP purple and random red) tested. The x-axis values are the AUC divergence score for the given feature selection + classifier combination of the 24 RTK-type-III inhibitors (red dots). (B) A linear regression was conducted to compare classifier 1 (x-axis) versus classifier 2 (y-axis) for all 24 RTK-TYPE-III inhibitors tested. The AUC scores for the 24 RTK-type-III inhibitors are plotted in a scatter plot, where the scores for one classifier are plotted against the scores of another classifier. The points in the graph are color coded to represent the different feature selection techniques according to the legend in the top left corner of the graph. A red line is plotted across the graph to show the correlation between the two models, with the variance plotted along the line as a yellow overlay. We see that there is a high correlation between the models, where the slope is not significantly different from 1 and the Intercept is not sig different from 0

