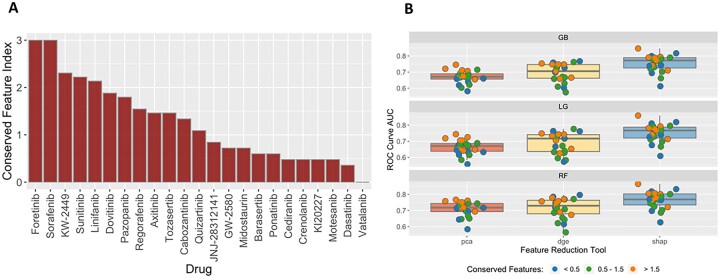
Fig. 5.
Analysis of feature conversation and model performance. (A) This plot shows the conservation index of the 24 RTK-type-III Inhibitor models. The y-axis corresponds to the conservation index value, whereas the x-axis corresponds to each of the 24 inhibitors. The conservation index value is calculated by taking the product of the feature counts divided by the sum squared. The higher the index value means the more features are shared across pipeline iterations. A low index value means that the features found in each fold are more unique and overlap less with the other folds. (B) A box-whisker plot for each feature selection tool (PCA red, DGE yellow and SHAP blue) was plotted for each model, top panel GB, middle panel LG and bottom panel RF. The random tool is omitted from this set of results because the features are assigned at random at each iteration so there is no conservation. Each box-whisker was generated using the AUC score for the given feature selection + classifier combination of the 24 RTK-type-III inhibitors. These scores are color coded (blue, green and orange) based on separating the conservation index (A) into three categorical bins: <0.5, 0.5–1.5 and >1.5

