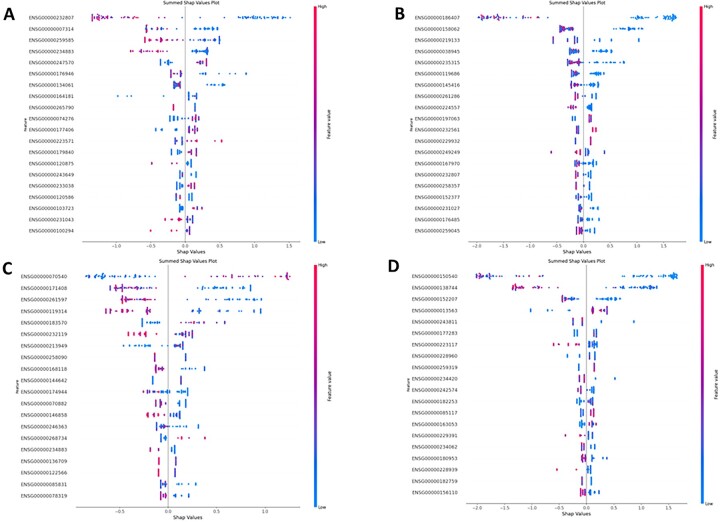
Fig. 6.
Feature importance plots for the top 4 performing RTK-type-III inhibitor models based SHAP contribution. The top 4 performing RTK-type-iii inhibitor models are assigned to a number as follows (A—Crenolanib, B—Dasatinib, C—Dovitinib and D—Foretinib). For each inhibitor a summed SHAP impact plot was generated. The y-label represents the model features ranked on largest summed SHAP value, from high to low. The x-axis represents the SHAP value score each observation has within a feature. Each observation is color coded based on the range of gene expression, where the closer the dot is to blue then the lower the gene expression value and the closer it is to red then the higher the gene expression value is

