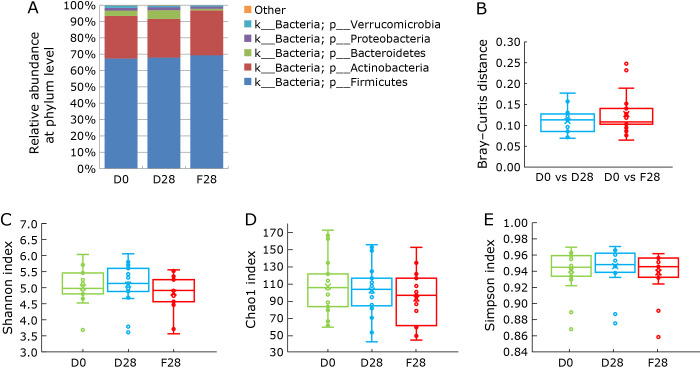
Fig. 4.
Taxonomic composition and diversity of the fecal microbiota in fresh (D0) and stored (D28 or F28) fecal samples. (A) Each component of the cumulative bar chart indicates a phylum. Taxonomic composition of the fecal microbiota at phylum level was evaluated among D0, F28, and D28. (B) Microbial community structure was evaluated by Bray–Curtis distance (p>0.05, Kruskal–Wallis test). The α-diversity was evaluated using Shannon (C), Chao1 (D), and Simpson (E) indices of the D0 and stored samples (D28 or F28) (p>0.05, Bonferroni–Dunn test).

