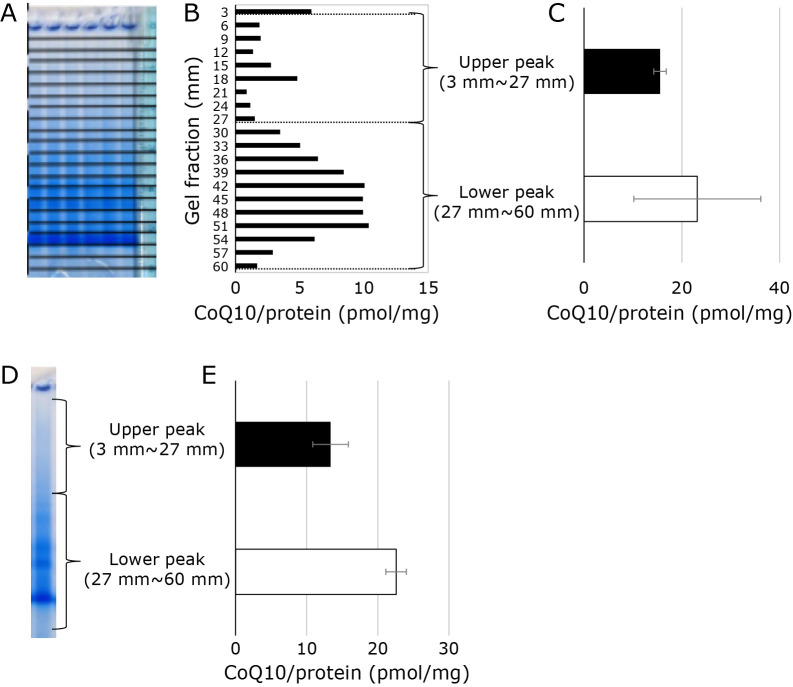
Fig. 2.
CoQ10 extraction from gel after blue native gel electrophoresis measurements results. (A) Amount of CoQ10 in gel fractionated to 3 mm. Left: Image of the gel when the gel is cut out every 3 mm. Middle: CoQ10 concentration in gel cut into 3 mm pieces. The CoQ10 value of a gel with an electrophoretic mobility of 0 to 3 mm is indicated as “3 mm”, and the CoQ10 value of a gel with an electrophoretic mobility of 3 to 6 mm”. CoQ10 value thus obtained is normalized with the amount of applied mitochondrial protein value (180 μg). Right: Sum of CoQ10 values of upper peak (3–27 mm) and lower peak (27–60 mm). (B) Amount of CoQ10 extracted from the “upper gel” and ”lower gel”. Left: Image of the gel when the gel fractionated in “upper gel” and “lower gel”. Right: Amount of CoQ10 in the “upper gel” and “lower gel”. CoQ10 value thus obtained is normalized with the amount of applied mitochondrial protein value.

