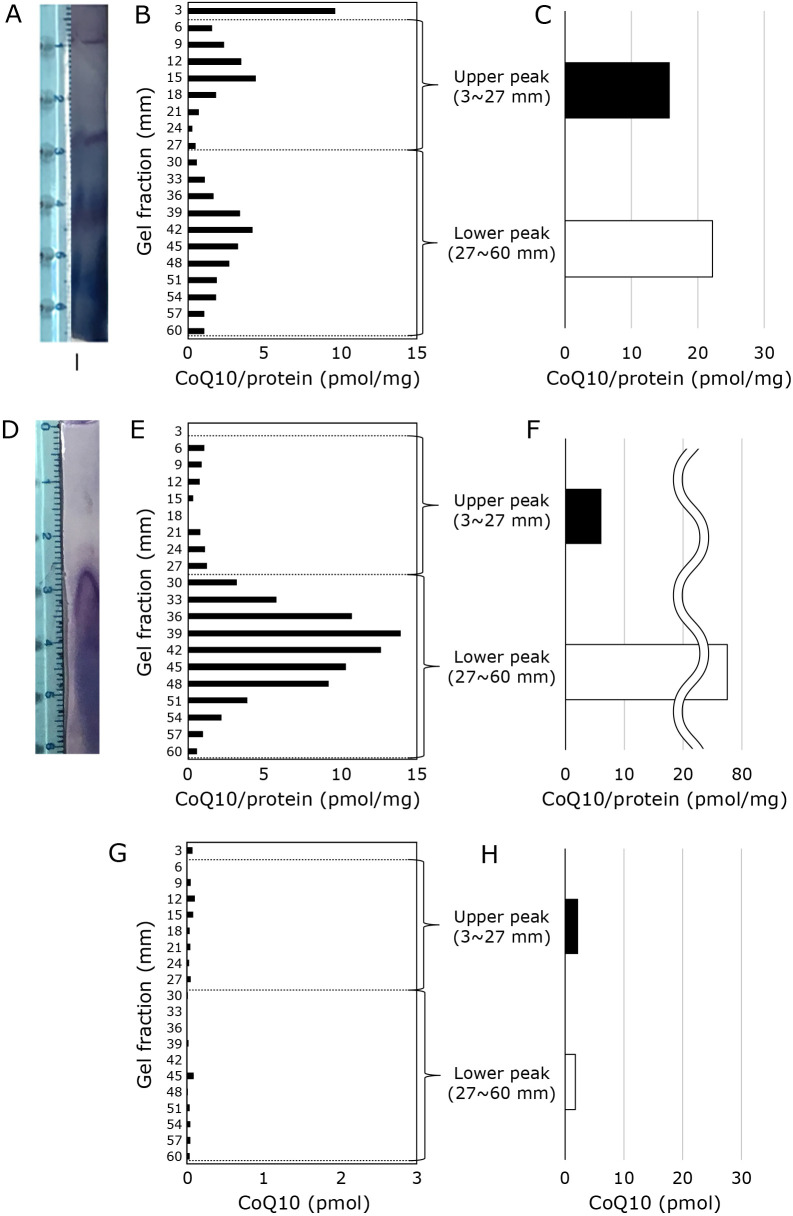
Fig. 3.
Effect of detergent on mitochondrial supercomplex in-gel enzyme activity assay and CoQ levels. (A–C) Detection of complex I and amount of CoQ10 in gel fraction of DIG-treated mitochondria sample. (A) Detection of complex I. (B) Amount of CoQ10 in the gel cut into 3 mm pieces. CoQ10 value thus obtained is normalized with the amount of applied mitochondrial protein value (180 μg). (C) Sum of CoQ10 values of upper peak (3–27 mm) and lower peak (27–60 mm). (D–F) Detection of complex I in DDM-treated mitochondria samples and the amount of CoQ10 in the gel fraction. (D) Detection of complex I. (E) Amount of CoQ10 in the gel cut into 3 mm pieces. CoQ10 value thus obtained is normalized with the amount of applied mitochondrial protein value (180 μg). (F) Sum of CoQ10 values of upper peak (3–27 mm) and lower peak (27–60 mm). (G–H) Amount of CoQ10 in gel fraction of DIG-treated CoQ10 solution. Amount of CoQ10 applied is consistent with the CoQ10 value in mitochondrial sample used in (A)–(F). (G) Amount of CoQ10 in the gel cut into 3 mm pieces. To compare with the result shown in (B) and (E), CoQ value obtained is divided into 0.18. This value is an applied protein value in BN-PAGE experiments, although this sample does not contain protein. (H) Sum of CoQ10 values of upper peak (3–27 mm) and lower peak (27–60 mm).

