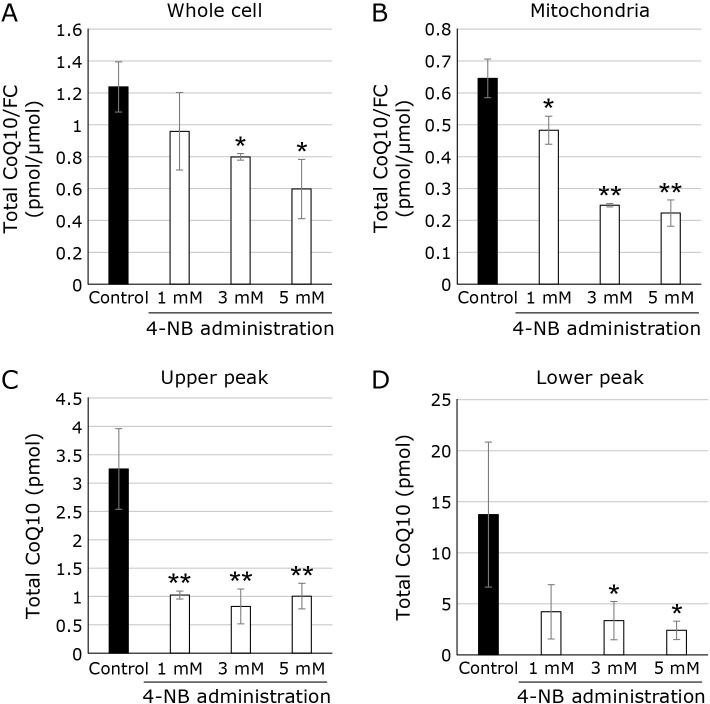
Fig. 4.
Measurement of CoQ10 in cell, mitochondria and mitochondrial SC with and without 4-NB treatment. (A) Intracellular CoQ10 level in cells treated with various concentrations of 4-NB (black bars: control, white bars: 4-NB treatment). Values are corrected for intracellular FC content. (B) Intracellular CoQ10 level in mitochondria treated with various concentrations of 4-NB (black bars: control, white bars: 4-NB treatment). Values are corrected for intracellular FC content. (C) CoQ10 content in upper peak (black bars: control, white bars: 4-NB treatment). (D) CoQ10 content in lower peak (black bars: control, white bars: 4-NB treatment).

