
Extended Data Fig. 2 |. Molecular profiling of calbindin-positive SATB1-negative immobility-active interneurons.
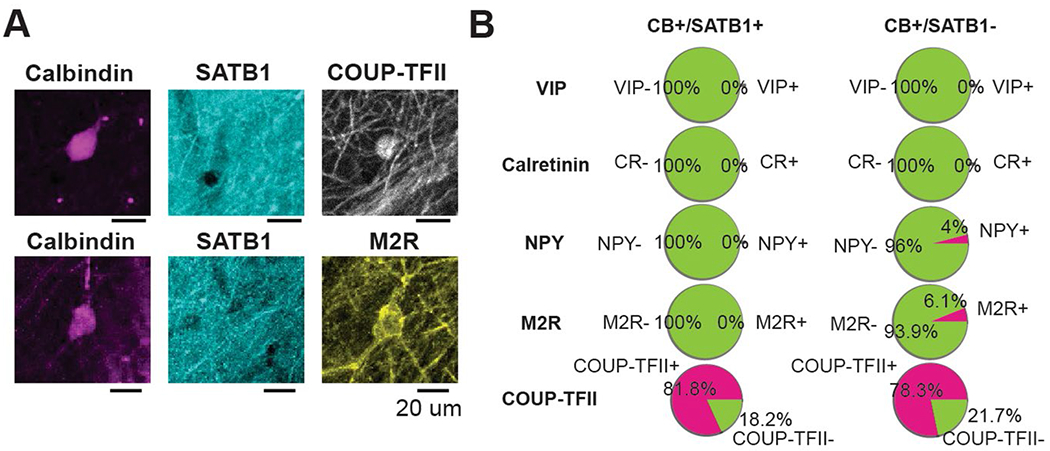
(a) Confocal micrograph of CB-expressing interneurons, negative for SATB1 but positive for COUP-TFII (top) and M2R (bottom). This staining was repeated in n = 2 mice. Scale bars represent 20 μm. (b) Quantification of the overlap of CB-expressing interneurons split by immunoreactivity to SATB1 with other markers.