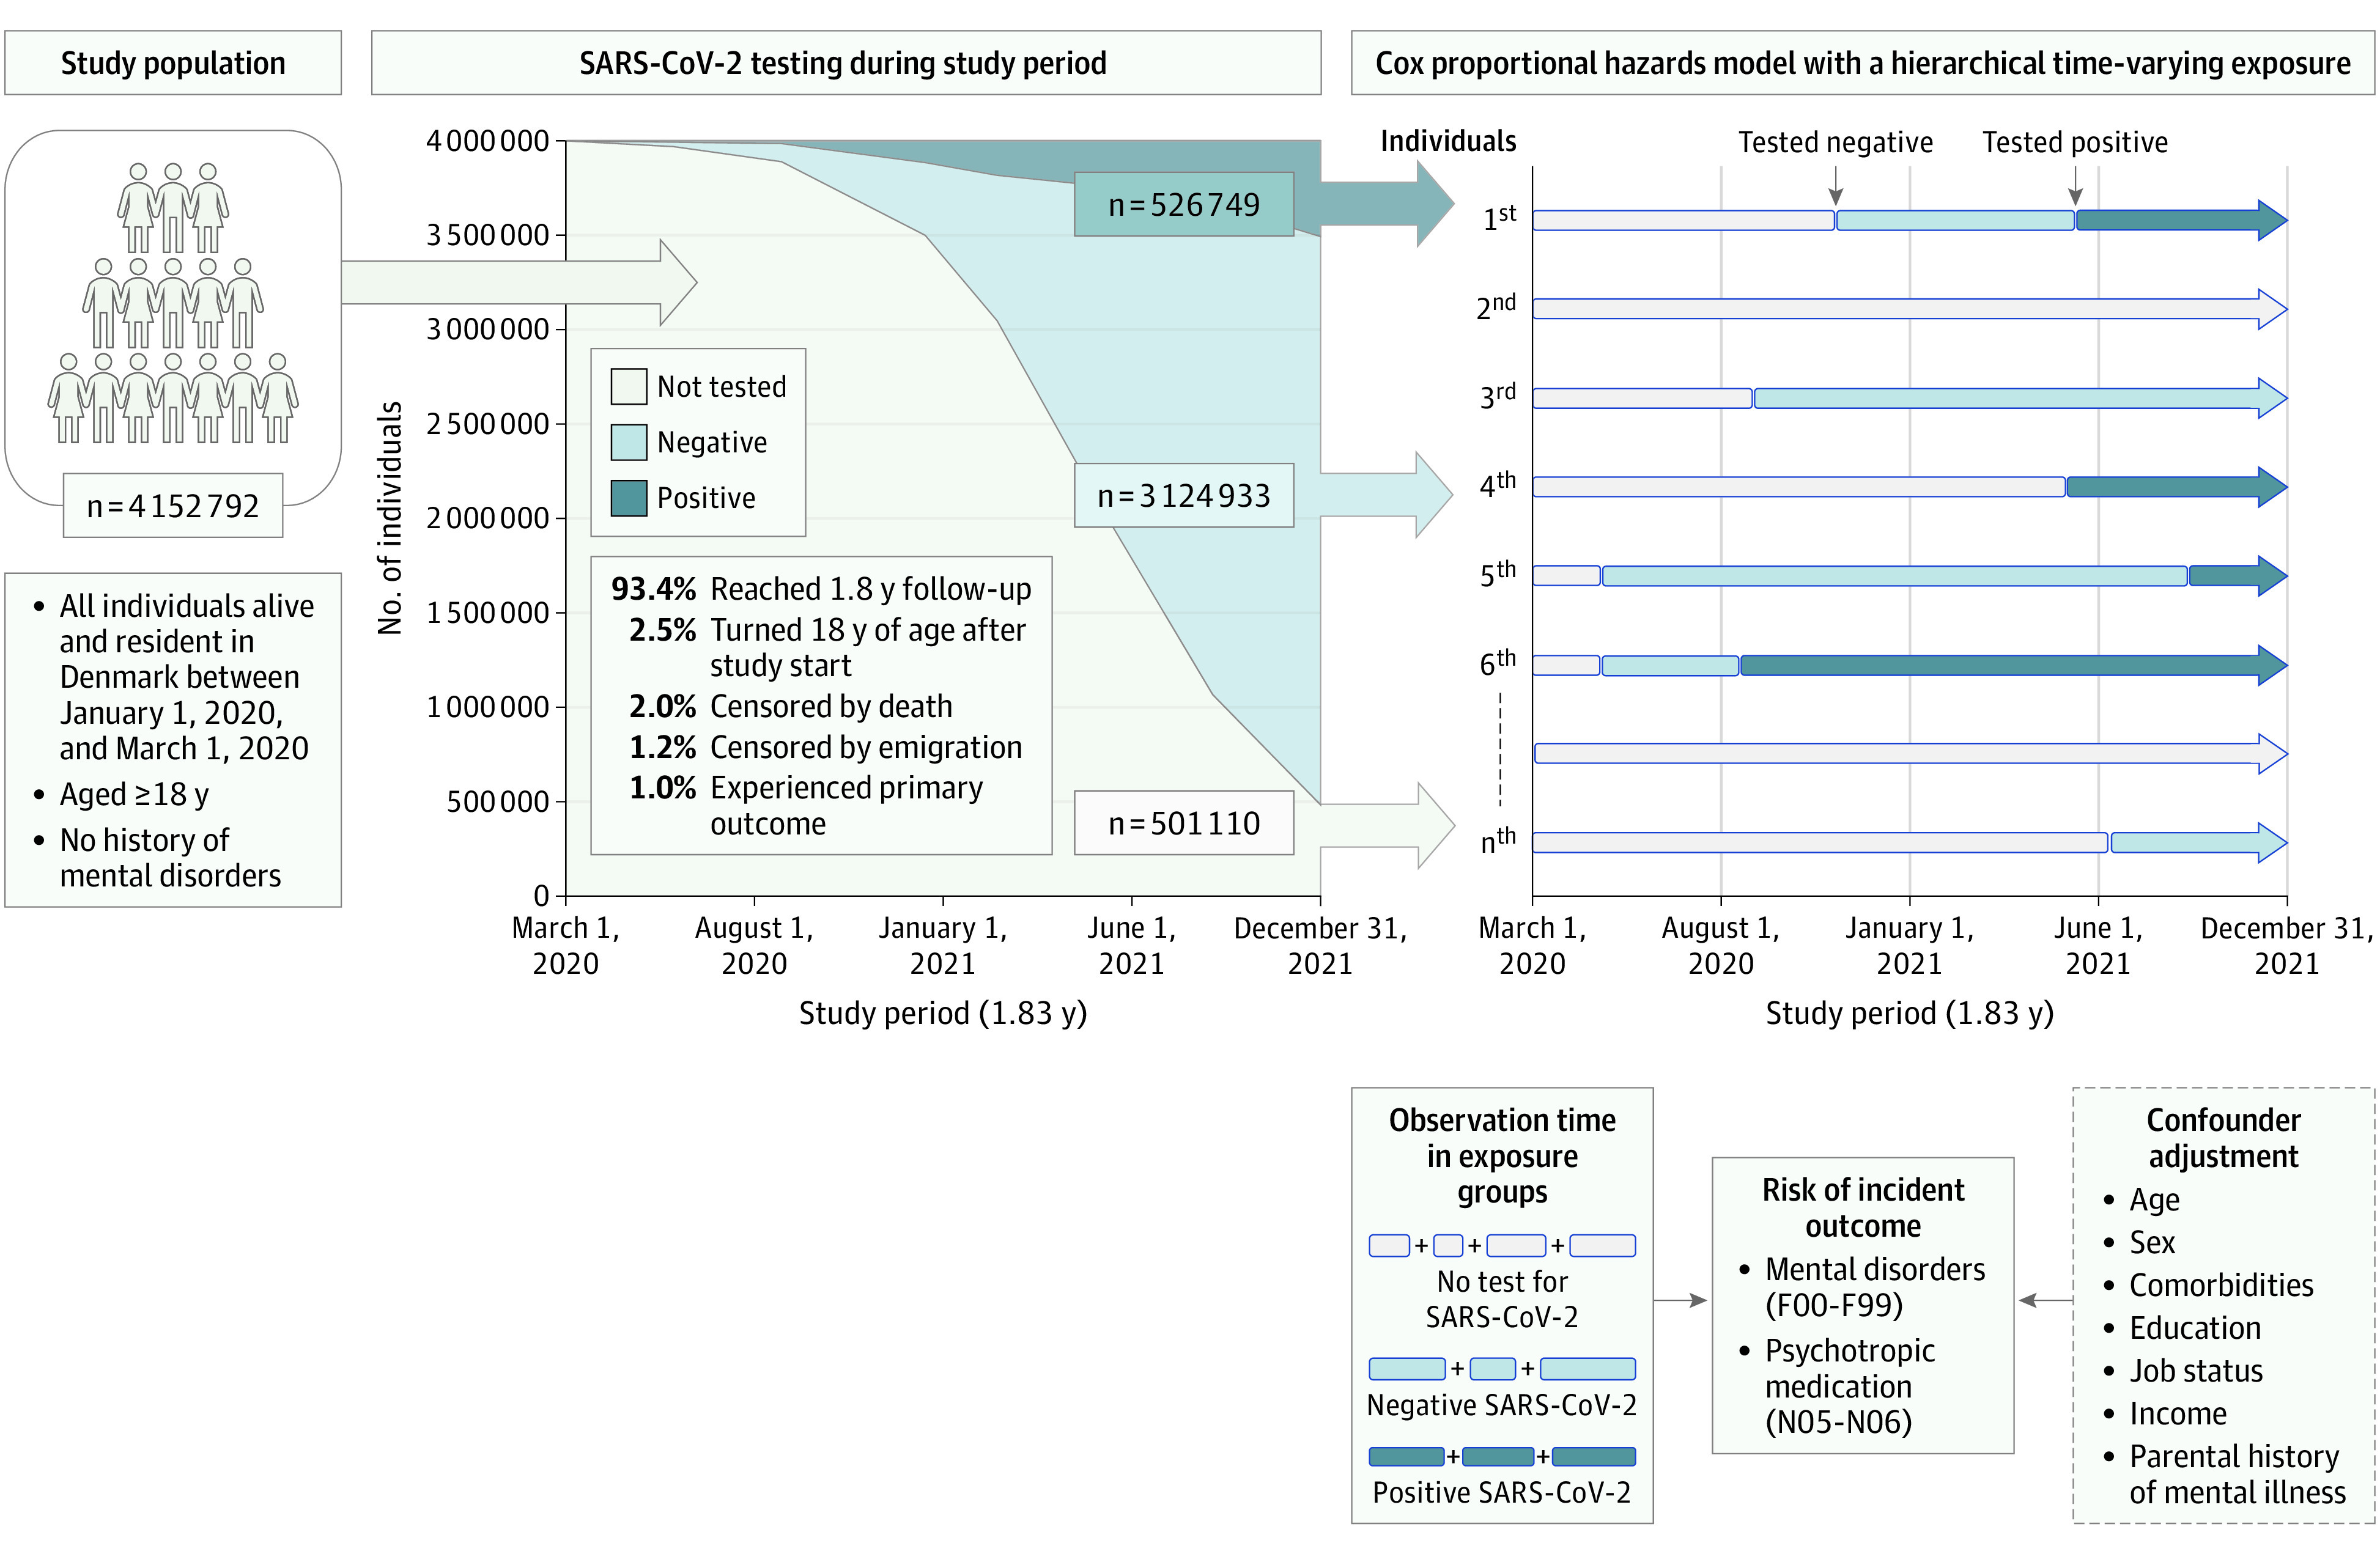
Figure 1. Schematic Presentation of Study Design and Structure of Data Analysis .

SARS-CoV-2 polymerase chain reaction testing of study population during the COVID-19 pandemic and how each individual contributes to observation time in potentially 3 different exposure groups are shown. Exposure is time-varying and hierarchical (ie, status can change from not tested to negative or positive and from negative to positive but not vice versa). Individual numbers 1st, 2nd, 3rd, etc, illustrate examples of each individual in the study contributing observation time to different groups of exposure.
