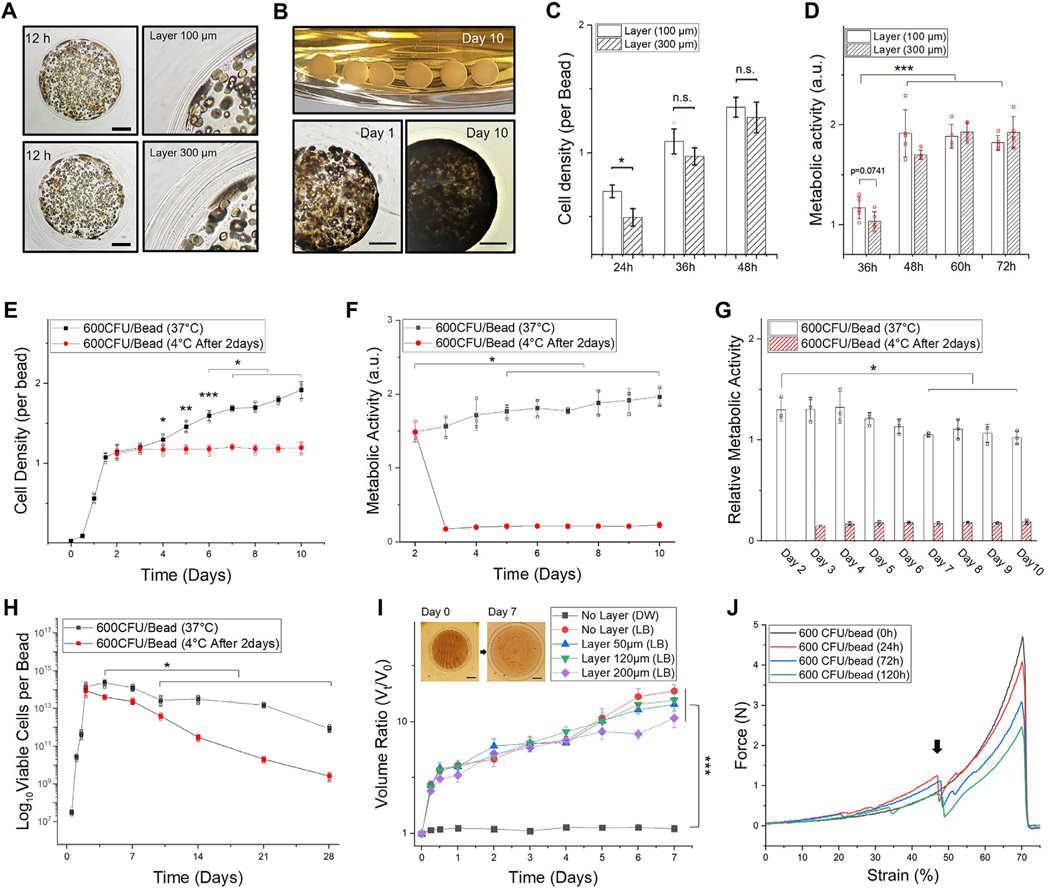
Fig. 3.
Thick hydrogel layer for long-term confinement. The core has an average diameter of 2 mm (WT E. coli 600 CFU/bead). A. A representative microscopic image (left) and magnified view (right) of hydrogel-shell beads with 100 and 300 μm of layer thickness. Scale bar is 500 μm. B. Image of hydrogel-shell beads cultured for 10 days (upper), microscopic images of hydrogel-shell beads with 300 μm of layer thickness in day 1 (lower-left) and day 10 (lower-right). Scale bar is 500 μm. C. Comparison of E. coli cell densities per bead. D. Comparison of metabolic activity with different layer thickness (n = 5, independent experiments per condition). E. Measurements of E. coli densities per bead for 10 days. F. Measurement of metabolic activities. G. Relative metabolic activity in cells. H. Viable cell counts of hydrogel beads cultivated for 4 weeks, determined by the standard plate method. The total viable cells per bead (y-axis) was plotted in the range of 107 to 1017 at the log scale. (E-H) Hydrogel-shell beads with 300 μm of layer thickness; after culturing the beads for 2 days the same experimental groups were placed in a cold room (4 °C) as a comparison group. I. Hydrogel bead swollen volume ratio ( V t / V 0 ). Volume of the beads at each time point (Vt) relative to initial volume ( V 0 ). J. Plot of force–deformation (as % strain) curves show the mechanical behavior of layered hydrogel beads after microbial colonization (0, 24, 72, and 120 h, respectively). The black arrow indicates layer breaking point. Data represent mean ± standard deviation ( n = 3, biological replicates per condition); *p < 0.05; **p < 0.01; and ***p < 0.001 Significance by student’s t-test and one-way ANOVA, unless otherwise noted.

