
Figure 1.
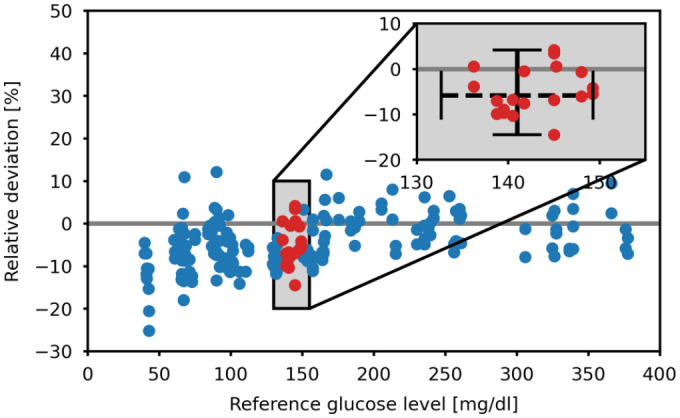
Exemplified calculation of the glucose expectation range of BGMS B for a true blood glucose level of 141 mg/dL. The red dots indicate data points in set S. The dashed horizontal line in the enlarged plot indicates the symmetric search region around the true blood glucose level. The vertical line indicates the range between the extreme values of the relative deviations in set S. BGMS, blood glucose monitoring system.