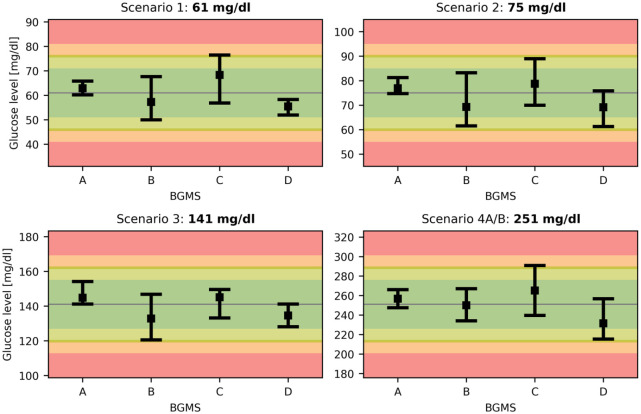
Figure 2.
Glucose expectation ranges (GER) for true glucose levels in scenarios 1-4. The GER give the interval in which a BG reading is expected to fall with a confidence level of at least 90%. The colored background indicates no, low, moderate, and high risk of adverse events resulting from BGMS readings. BGMS, blood glucose monitoring systems.

